29
/fr/
fr
AIzaSyAYiBZKx7MnpbEhh9jyipgxe19OcubqV5w
April 1, 2024
25958
Central Europe and the Baltics
CEB
false
2
1
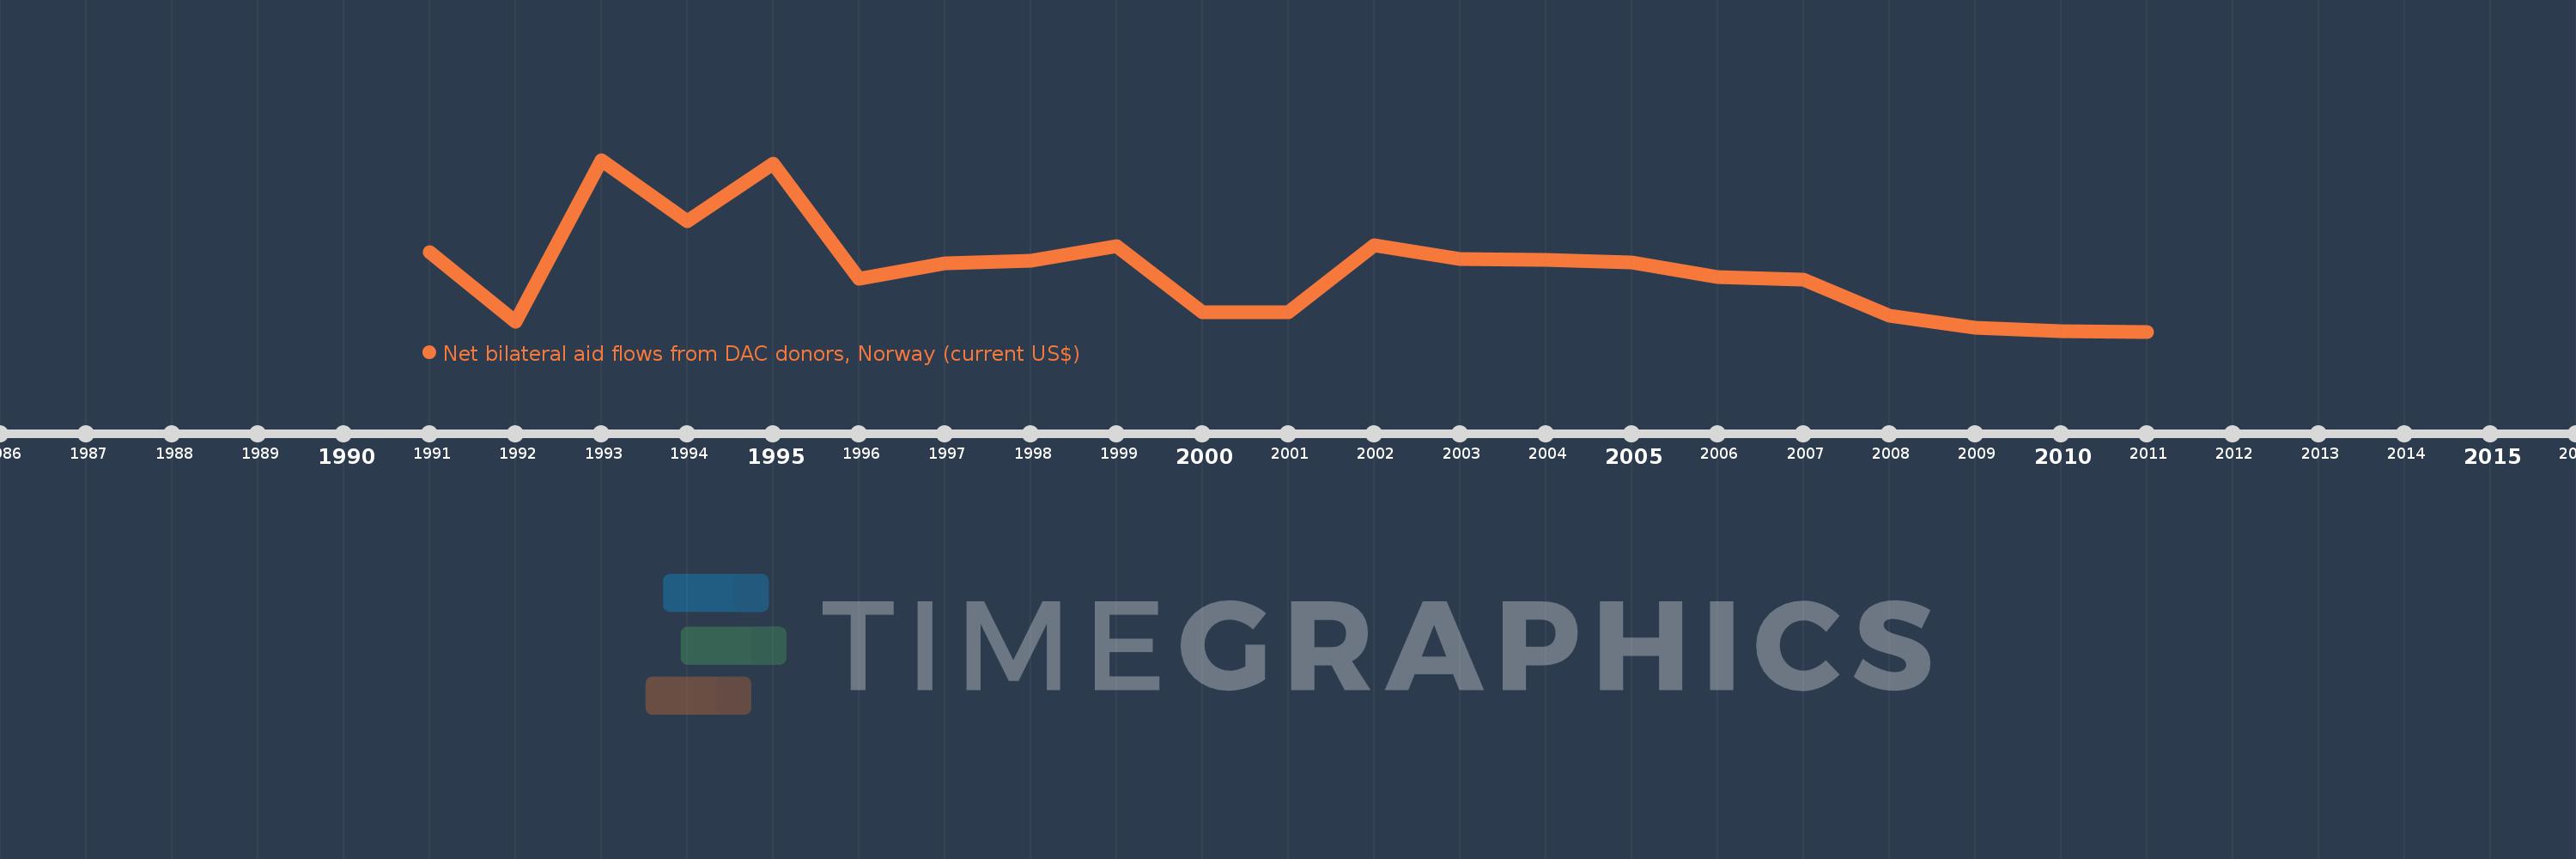
Net bilateral aid flows from DAC donors, Norway (current US$)
2011,2010,2009,2008,2007,2006,2005,2004,2003,2002,2001,2000,1999,1998,1997,1996,1995,1994,1993,1992,1991
Cette statistique dans les autres pays:
AfghanistanAlbaniaAlgeriaAngolaAntigua and BarbudaArab WorldArgentinaArmeniaAzerbaijanBahrainBangladeshBarbadosBelarusBelizeBeninBermudaBhutanBoliviaBosnia and HerzegovinaBotswanaBrazilBulgariaBurkina FasoBurundiCabo VerdeCambodiaCameroonCaribbean small statesCentral African RepublicCentral Europe and the BalticsChadChileChinaColombiaComorosCongo, Dem. Rep.Congo, Rep.Costa RicaCote d'IvoireCroatiaCubaCyprusCzech RepublicDjiboutiDominican RepublicEast Asia & PacificEast Asia & Pacific (excluding high income)East Asia & Pacific (IDA & IBRD countries)EcuadorEgypt, Arab Rep.El SalvadorEquatorial GuineaEritreaEstoniaEthiopiaEuro areaEurope & Central AsiaEurope & Central Asia (excluding high income)Europe & Central Asia (IDA & IBRD countries)European UnionFijiFragile and conflict affected situationsGabonGambia, TheGeorgiaGhanaGibraltarGrenadaGuatemalaGuineaGuinea-BissauGuyanaHaitiHeavily indebted poor countries (HIPC)High incomeHondurasHong Kong SAR, ChinaHungaryIBRD onlyIDA & IBRD totalIDA blendIDA onlyIDA totalIndiaIndonesiaIran, Islamic Rep.IraqIsraelJamaicaJordanKazakhstanKenyaKiribatiKorea, Dem. People’s Rep.Korea, Rep.KosovoKuwaitKyrgyz RepublicLao PDRLatin America & Caribbean Latin America & Caribbean (excluding high income)Latin America & the Caribbean (IDA & IBRD countries)LatviaLeast developed countries: UN classificationLebanonLesothoLiberiaLibyaLithuaniaLow & middle incomeLow incomeLower middle incomeMacao SAR, ChinaMacedonia, FYRMadagascarMalawiMalaysiaMaldivesMaliMaltaMarshall IslandsMauritaniaMauritiusMexicoMiddle East & North AfricaMiddle East & North Africa (excluding high income)Middle East & North Africa (IDA & IBRD countries)Middle incomeMoldovaMongoliaMontenegroMoroccoMozambiqueMyanmarNamibiaNauruNepalNicaraguaNigerNigeriaNorth AmericaOECD membersOmanOther small statesPacific island small statesPakistanPanamaPapua New GuineaParaguayPeruPhilippinesPolandRomaniaRussian FederationRwandaSamoaSao Tome and PrincipeSaudi ArabiaSenegalSerbiaSeychellesSierra LeoneSingaporeSlovak RepublicSloveniaSmall statesSolomon IslandsSomaliaSouth AfricaSouth AsiaSouth Asia (IDA & IBRD)South SudanSri LankaSt. Kitts and NevisSt. LuciaSt. Vincent and the GrenadinesSub-Saharan Africa Sub-Saharan Africa (excluding high income)Sub-Saharan Africa (IDA & IBRD countries)SudanSurinameSwazilandSyrian Arab RepublicTajikistanTanzaniaThailandTimor-LesteTogoTongaTrinidad and TobagoTunisiaTurkeyTurkmenistanUgandaUkraineUnited Arab EmiratesUpper middle incomeUruguayUzbekistanVanuatuVenezuela, RBVietnamWest Bank and GazaWorldYemen, Rep.ZambiaZimbabwe La ligne de temps
Cette échelle de temps montre un graphique de 1991 année à 2011 année Central Europe and the Baltics. Les données jusqu'à 1990 année ne sont pas présentés. Quantité d'observations actuelles selon dates: 21.
Source (désignation):
Les indicateurs du développement mondiale
Source (organisation):
Development Assistance Committee of the Organisation for Economic Co-operation and Development, Geographical Distribution of Financial Flows to Developing Countries, Development Co-operation Report, and International Development Statistics database. Data are available online at: www.oecd.org/dac/stats/idsonline.
Catégories:
Aid Effectiveness
Dernière mise à jour
23 avr. 2017
Les indicateurs de changement de valeurs selon les années
Minimum:
3.46 mln.
1 janv. 2011
Maximum:
41.47 mln.
1 janv. 1993
Pour la date d''observation
Valeur
Changement absolu
Le changement par rapport à la valeur précédente
1 janv. 1991
21.11 mln.
+21.11 mln.
0.0%
1 janv. 1992
5.65 mln.
-15.46 mln.
-73.24%
1 janv. 1993
41.47 mln.
+35.82 mln.
633.98%
1 janv. 1994
27.87 mln.
-13.6 mln.
-32.79%
1 janv. 1995
40.67 mln.
+12.8 mln.
45.93%
1 janv. 1996
15.21 mln.
-25.46 mln.
-62.6%
1 janv. 1997
18.51 mln.
+3.3 mln.
21.7%
1 janv. 1998
19.14 mln.
+630.0 milles
3.4%
1 janv. 1999
22.28 mln.
+3.14 mln.
16.41%
1 janv. 2000
7.76 mln.
-14.52 mln.
-65.17%
1 janv. 2001
7.79 mln.
+30.0 milles
0.39%
1 janv. 2002
22.6 mln.
+14.81 mln.
190.12%
1 janv. 2003
19.46 mln.
-3.14 mln.
-13.89%
1 janv. 2004
19.34 mln.
-120.0 milles
-0.62%
1 janv. 2005
18.74 mln.
-600.0 milles
-3.1%
1 janv. 2006
15.49 mln.
-3.25 mln.
-17.34%
1 janv. 2007
14.94 mln.
-550.0 milles
-3.55%
1 janv. 2008
6.92 mln.
-8.02 mln.
-53.68%
1 janv. 2009
4.23 mln.
-2.69 mln.
-38.87%
1 janv. 2010
3.6 mln.
-630.0 milles
-14.89%
1 janv. 2011
3.46 mln.
-140.0 milles
-3.89%
Classement des pays selon les statistiques actuelles par années


Commentaires: