29
/fr/
fr
AIzaSyAYiBZKx7MnpbEhh9jyipgxe19OcubqV5w
April 1, 2024
258910
Syrian Arab Republic
SYR
true
2
1
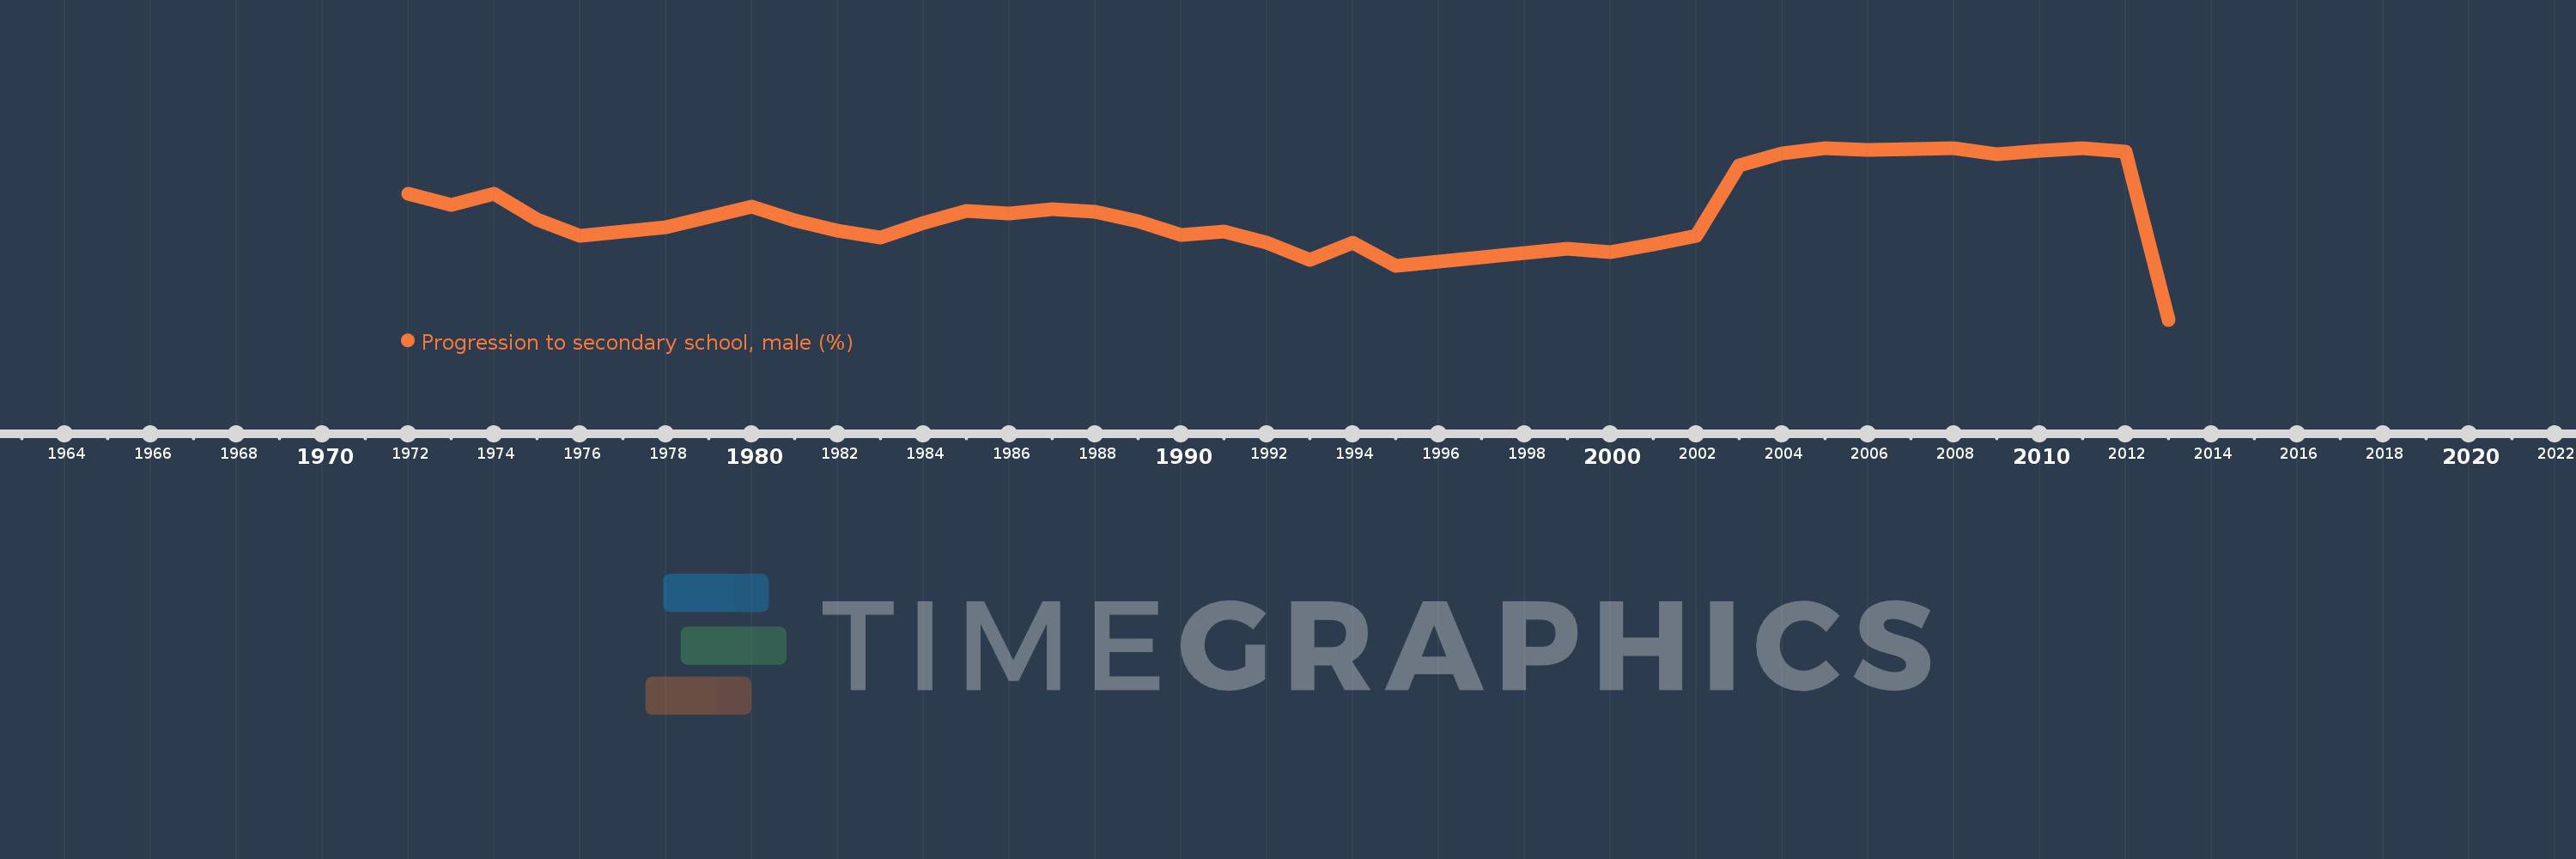
Progression to secondary school, male (%)
2013,2012,2011,2010,2009,2008,2007,2006,2005,2004,2003,2002,2001,2000,1999,1995,1994,1993,1992,1991,1990,1989,1988,1987,1986,1985,1984,1983,1982,1981,1980,1979,1978,1976,1975,1974,1973,1972
Cette statistique dans les autres pays:
AfghanistanAlbaniaAlgeriaAngolaAntigua and BarbudaArab WorldArgentinaArmeniaArubaAustriaAzerbaijanBahamas, TheBahrainBarbadosBelarusBelgiumBelizeBeninBermudaBhutanBoliviaBosnia and HerzegovinaBotswanaBrazilBritish Virgin IslandsBrunei DarussalamBulgariaBurkina FasoBurundiCabo VerdeCambodiaCameroonCaribbean small statesCayman IslandsCentral African RepublicCentral Europe and the BalticsChadChileChinaColombiaComorosCongo, Dem. Rep.Congo, Rep.Costa RicaCote d'IvoireCroatiaCubaCyprusCzech RepublicDenmarkDjiboutiDominicaDominican RepublicEarly-demographic dividendEast Asia & PacificEast Asia & Pacific (excluding high income)East Asia & Pacific (IDA & IBRD countries)EcuadorEgypt, Arab Rep.El SalvadorEquatorial GuineaEritreaEstoniaEthiopiaEuro areaEurope & Central AsiaEurope & Central Asia (excluding high income)Europe & Central Asia (IDA & IBRD countries)European UnionFijiFinlandFragile and conflict affected situationsGabonGambia, TheGeorgiaGermanyGhanaGreeceGrenadaGuatemalaGuineaGuinea-BissauGuyanaHaitiHeavily indebted poor countries (HIPC)High incomeHondurasHong Kong SAR, ChinaHungaryIBRD onlyIcelandIDA & IBRD totalIDA blendIDA onlyIDA totalIndiaIndonesiaIran, Islamic Rep.IraqIsraelItalyJamaicaJapanJordanKazakhstanKenyaKiribatiKorea, Rep.KuwaitKyrgyz RepublicLao PDRLate-demographic dividendLatin America & Caribbean Latin America & Caribbean (excluding high income)Latin America & the Caribbean (IDA & IBRD countries)LatviaLeast developed countries: UN classificationLebanonLesothoLiberiaLibyaLiechtensteinLithuaniaLow & middle incomeLow incomeLower middle incomeLuxembourgMacao SAR, ChinaMacedonia, FYRMadagascarMalawiMalaysiaMaldivesMaliMaltaMarshall IslandsMauritaniaMauritiusMexicoMiddle East & North AfricaMiddle East & North Africa (excluding high income)Middle East & North Africa (IDA & IBRD countries)Middle incomeMoldovaMonacoMongoliaMoroccoMozambiqueMyanmarNamibiaNepalNetherlandsNicaraguaNigerNorwayOECD membersOmanOther small statesPacific island small statesPakistanPalauPanamaParaguayPeruPhilippinesPolandPortugalPost-demographic dividendPre-demographic dividendQatarRomaniaRussian FederationRwandaSamoaSan MarinoSao Tome and PrincipeSaudi ArabiaSenegalSerbiaSeychellesSierra LeoneSingaporeSlovak RepublicSloveniaSmall statesSolomon IslandsSouth AfricaSouth AsiaSouth Asia (IDA & IBRD)SpainSri LankaSt. Kitts and NevisSt. LuciaSt. Vincent and the GrenadinesSub-Saharan Africa Sub-Saharan Africa (excluding high income)Sub-Saharan Africa (IDA & IBRD countries)SudanSurinameSwazilandSwedenSwitzerlandSyrian Arab RepublicTajikistanTanzaniaThailandTimor-LesteTogoTongaTrinidad and TobagoTunisiaTurkeyTurks and Caicos IslandsTuvaluUgandaUkraineUnited Arab EmiratesUpper middle incomeUruguayUzbekistanVanuatuVenezuela, RBVietnamWest Bank and GazaWorldYemen, Rep.ZambiaZimbabwe La ligne de temps
Cette échelle de temps montre un graphique de 1972 année à 2013 année Syrian Arab Republic. Les données jusqu'à 1971 année ne sont pas présentés. Quantité d'observations actuelles selon dates: 38.
Source (désignation):
Les indicateurs du développement mondiale
Source (organisation):
United Nations Educational, Scientific, and Cultural Organization (UNESCO) Institute for Statistics.
Catégories:
Education, Gender
Dernière mise à jour
23 avr. 2017
Les indicateurs de changement de valeurs selon les années
Maximum:
98.73
1 janv. 2011
Pour la date d''observation
Valeur
Changement absolu
Le changement par rapport à la valeur précédente
1 janv. 1972
87.642
+87.642
0.0%
1 janv. 1973
84.976
-2.666
-3.04%
1 janv. 1974
87.648
+2.671
3.14%
1 janv. 1975
81.479
-6.168
-7.04%
1 janv. 1976
77.406
-4.073
-5.0%
1 janv. 1978
79.541
+2.135
2.76%
1 janv. 1979
82.099
+2.558
3.22%
1 janv. 1980
84.461
+2.363
2.88%
1 janv. 1981
81.171
-3.29
-3.9%
1 janv. 1982
78.765
-2.406
-2.96%
1 janv. 1983
77.125
-1.64
-2.08%
1 janv. 1984
80.509
+3.384
4.39%
1 janv. 1985
83.485
+2.977
3.7%
1 janv. 1986
82.862
-0.623
-0.75%
1 janv. 1987
83.829
+0.967
1.17%
1 janv. 1988
83.228
-0.601
-0.72%
1 janv. 1989
81.109
-2.119
-2.55%
1 janv. 1990
77.783
-3.326
-4.1%
1 janv. 1991
78.568
+0.785
1.01%
1 janv. 1992
75.786
-2.782
-3.54%
1 janv. 1993
71.672
-4.115
-5.43%
1 janv. 1994
75.768
+4.097
5.72%
1 janv. 1995
70.147
-5.622
-7.42%
1 janv. 1999
74.291
+4.144
5.91%
1 janv. 2000
73.492
-0.799
-1.08%
1 janv. 2001
75.44
+1.948
2.65%
1 janv. 2002
77.462
+2.022
2.68%
1 janv. 2003
94.414
+16.951
21.88%
1 janv. 2004
97.411
+2.997
3.17%
1 janv. 2005
98.566
+1.155
1.19%
1 janv. 2006
98.343
-0.223
-0.23%
1 janv. 2007
98.488
+0.145
0.15%
1 janv. 2008
98.615
+0.127
0.13%
1 janv. 2009
97.239
-1.376
-1.4%
1 janv. 2010
98.035
+0.797
0.82%
1 janv. 2011
98.73
+0.694
0.71%
1 janv. 2012
97.935
-0.795
-0.8%
1 janv. 2013
57.2
-40.735
-41.59%
Classement des pays selon les statistiques actuelles par années


Commentaires: