30
/fr/
AIzaSyAYiBZKx7MnpbEhh9jyipgxe19OcubqV5w
April 1, 2024
258849
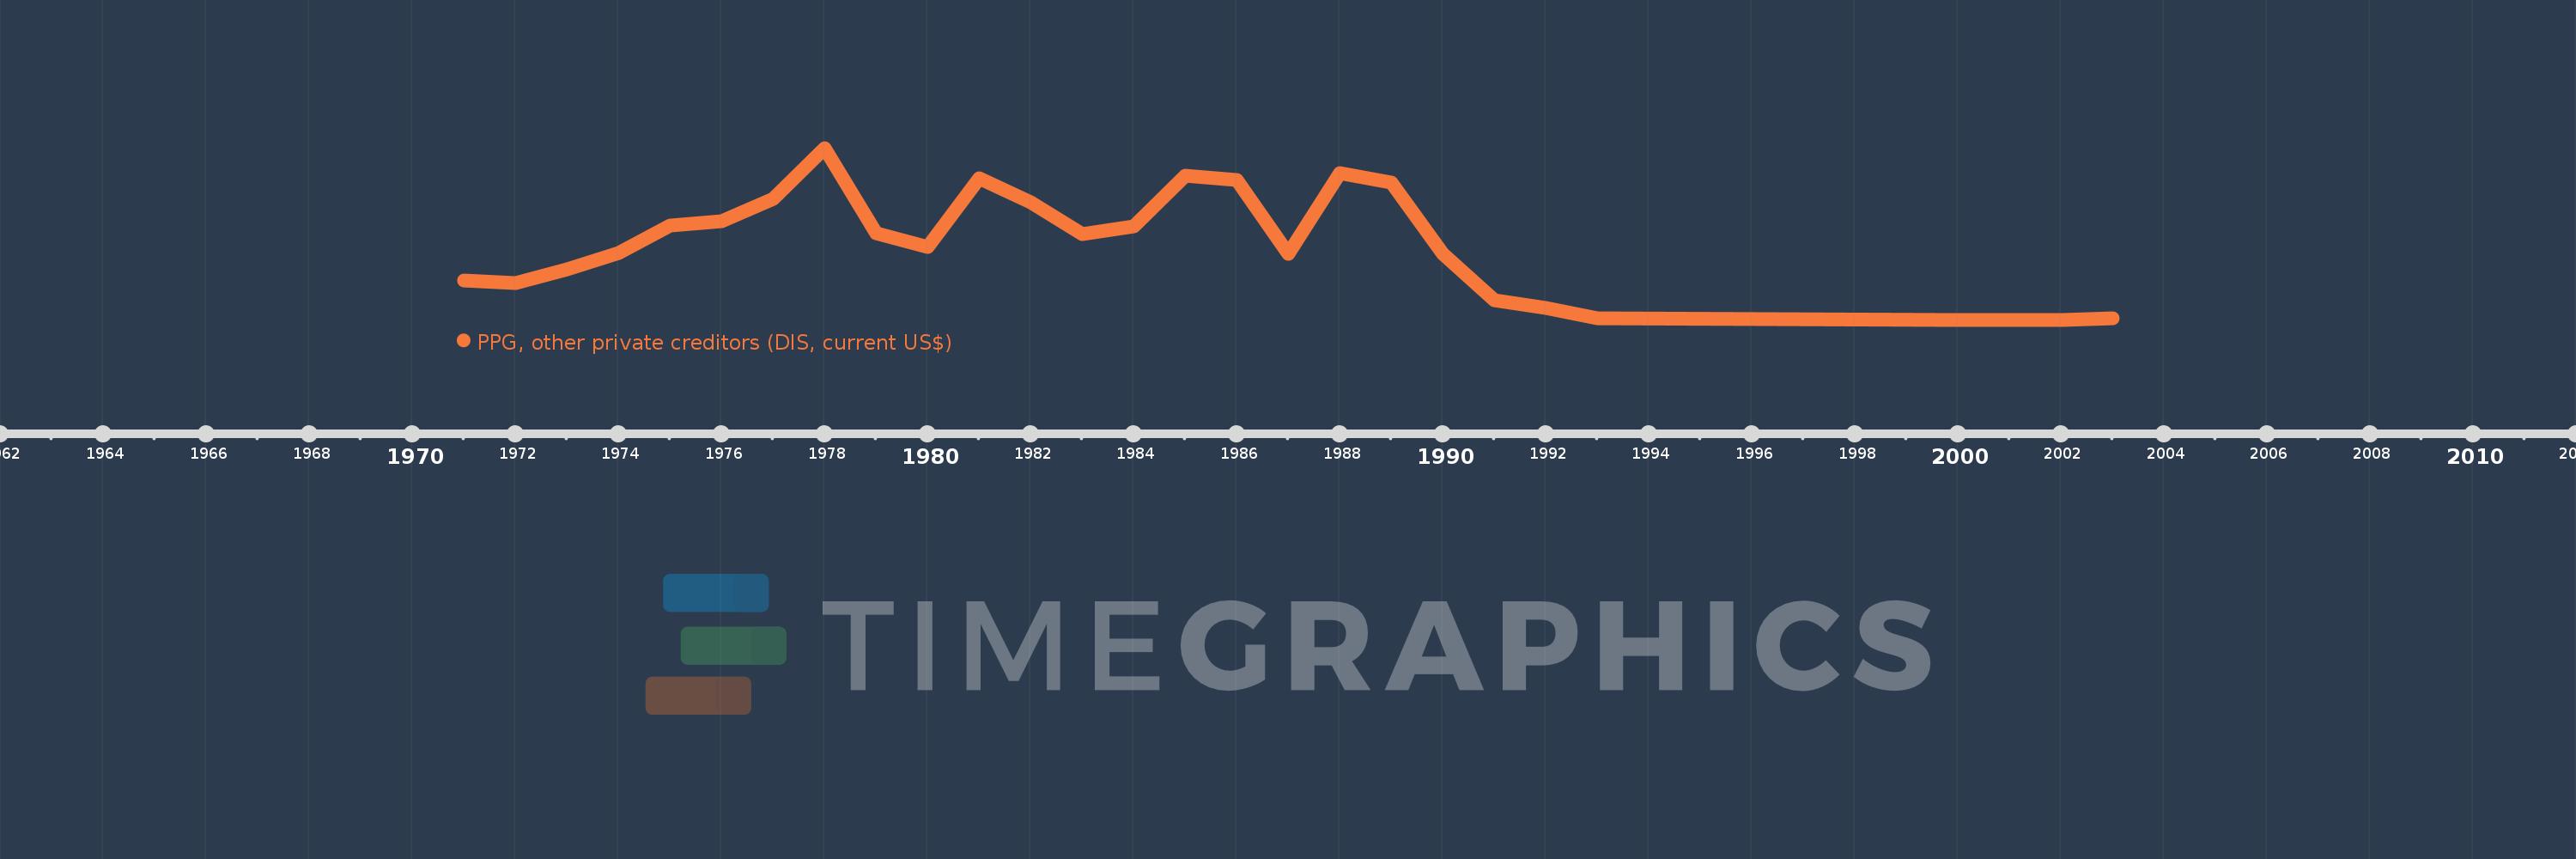
Syrian Arab Republic
SYR
true
2
1
PPG, other private creditors (DIS, current US$)
2003,2002,2001,2000,1993,1992,1991,1990,1989,1988,1987,1986,1985,1984,1983,1982,1981,1980,1979,1978,1977,1976,1975,1974,1973,1972,1971
