29
/fr/
fr
AIzaSyAYiBZKx7MnpbEhh9jyipgxe19OcubqV5w
April 1, 2024
257415
Switzerland
CHE
true
2
1
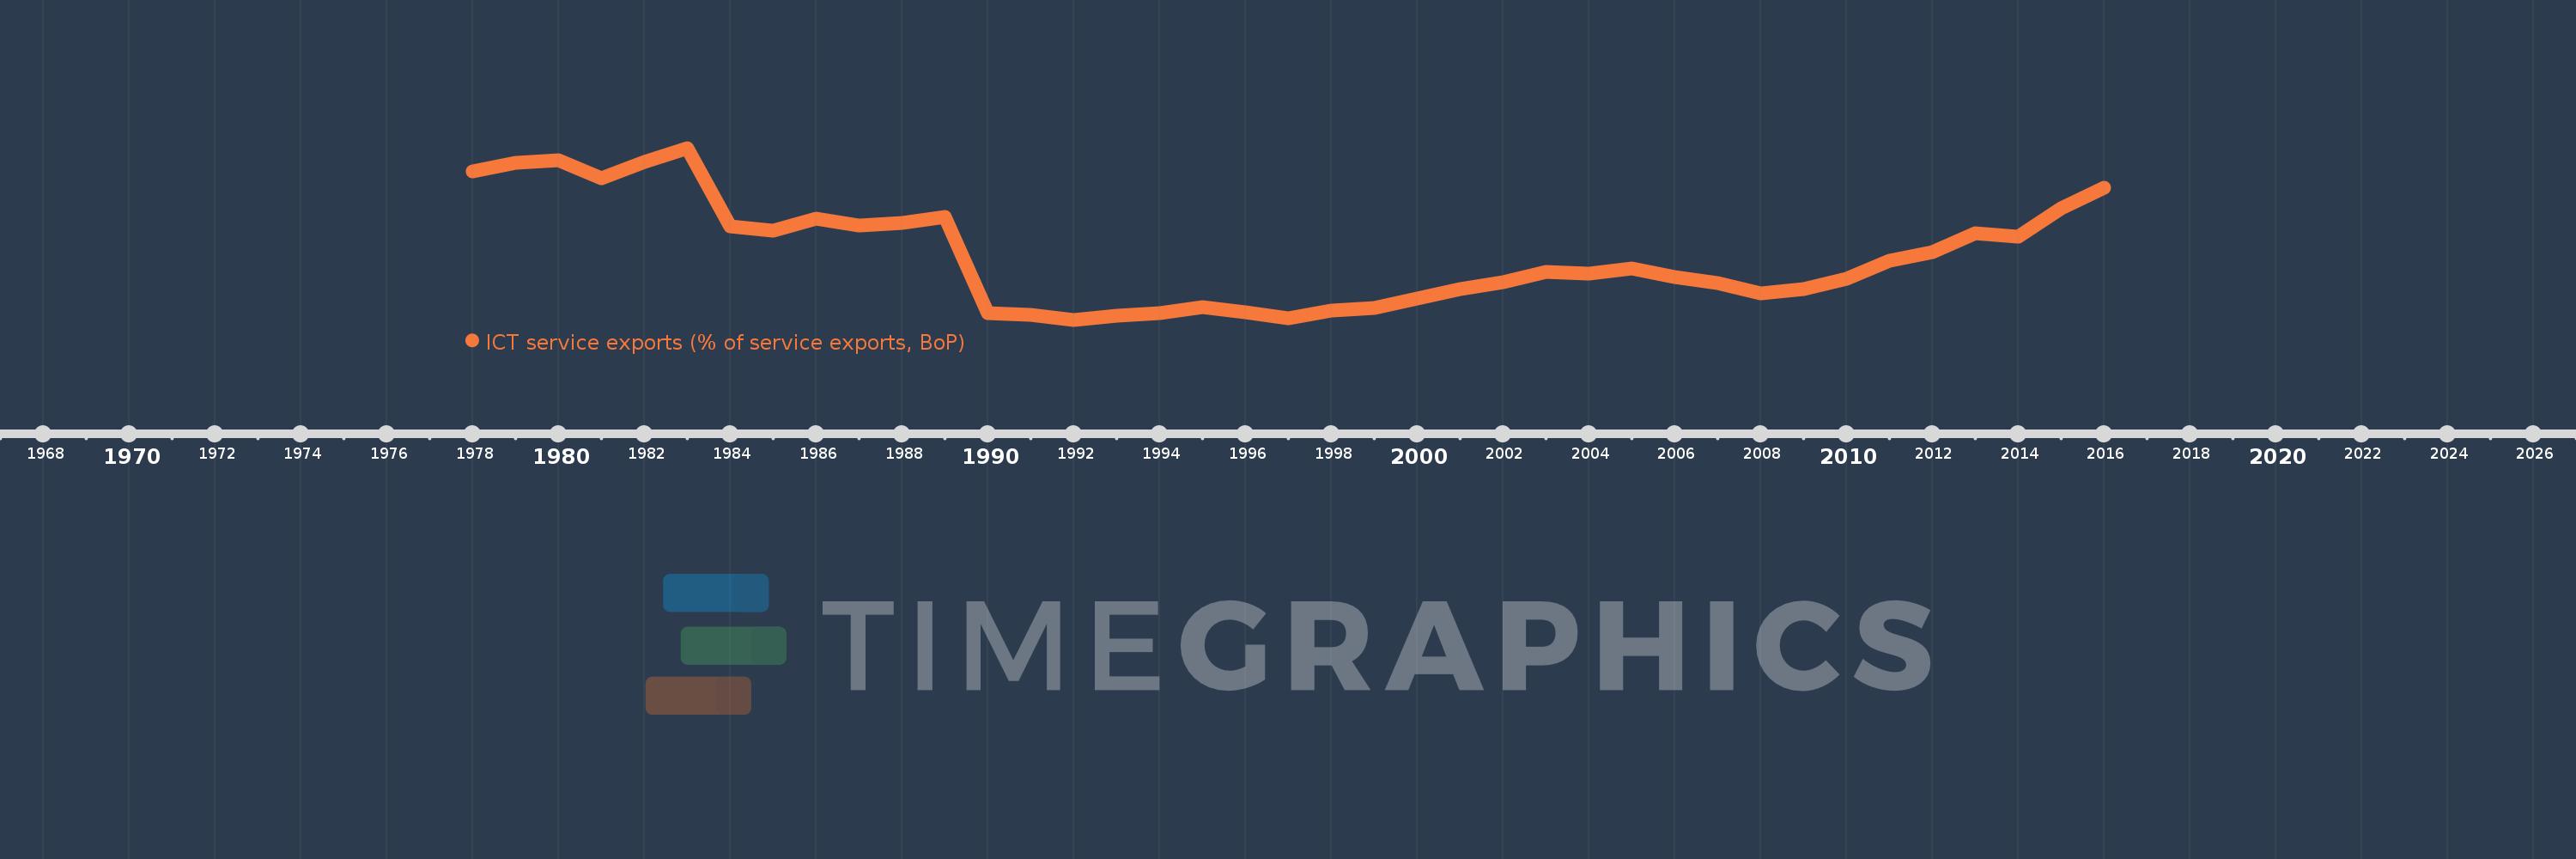
ICT service exports (% of service exports, BoP)
2016,2015,2014,2013,2012,2011,2010,2009,2008,2007,2006,2005,2004,2003,2002,2001,2000,1999,1998,1997,1996,1995,1994,1993,1992,1991,1990,1989,1988,1987,1986,1985,1984,1983,1982,1981,1980,1979,1978
Cette statistique dans les autres pays:
AfghanistanAlbaniaAlgeriaAngolaAntigua and BarbudaArgentinaArmeniaArubaAustraliaAustriaAzerbaijanBahrainBangladeshBarbadosBelarusBelgiumBelizeBeninBermudaBhutanBoliviaBosnia and HerzegovinaBotswanaBrazilBrunei DarussalamBulgariaBurkina FasoBurundiCabo VerdeCambodiaCameroonCanadaCaribbean small statesCentral Europe and the BalticsChileChinaColombiaComorosCongo, Dem. Rep.Congo, Rep.Costa RicaCote d'IvoireCroatiaCuracaoCyprusCzech RepublicDenmarkDjiboutiDominicaDominican RepublicEarly-demographic dividendEast Asia & PacificEast Asia & Pacific (excluding high income)East Asia & Pacific (IDA & IBRD countries)EcuadorEgypt, Arab Rep.El SalvadorEritreaEstoniaEthiopiaEuro areaEurope & Central AsiaEurope & Central Asia (excluding high income)Europe & Central Asia (IDA & IBRD countries)European UnionFaroe IslandsFijiFinlandFranceFrench PolynesiaGabonGambia, TheGeorgiaGermanyGreeceGrenadaGuatemalaGuineaGuinea-BissauGuyanaHeavily indebted poor countries (HIPC)High incomeHondurasHong Kong SAR, ChinaHungaryIBRD onlyIcelandIDA & IBRD totalIDA onlyIndiaIndonesiaIraqIrelandIsraelItalyJamaicaJapanJordanKazakhstanKenyaKorea, Rep.KosovoKuwaitKyrgyz RepublicLao PDRLate-demographic dividendLatin America & Caribbean Latin America & Caribbean (excluding high income)Latin America & the Caribbean (IDA & IBRD countries)LatviaLeast developed countries: UN classificationLebanonLesothoLithuaniaLow & middle incomeLow incomeLower middle incomeLuxembourgMacao SAR, ChinaMacedonia, FYRMadagascarMalawiMalaysiaMaliMaltaMauritaniaMauritiusMexicoMicronesia, Fed. Sts.Middle incomeMoldovaMongoliaMontenegroMoroccoMozambiqueMyanmarNamibiaNepalNetherlandsNew CaledoniaNew ZealandNicaraguaNigerNigeriaNorth AmericaNorwayOECD membersOmanPacific island small statesPakistanPalauPanamaPapua New GuineaParaguayPeruPhilippinesPolandPortugalPost-demographic dividendPre-demographic dividendRomaniaRussian FederationRwandaSamoaSao Tome and PrincipeSaudi ArabiaSenegalSerbiaSeychellesSierra LeoneSingaporeSint Maarten (Dutch part)Slovak RepublicSloveniaSolomon IslandsSouth AfricaSouth AsiaSouth Asia (IDA & IBRD)South SudanSpainSri LankaSt. Kitts and NevisSt. LuciaSt. Vincent and the GrenadinesSub-Saharan Africa Sub-Saharan Africa (excluding high income)Sub-Saharan Africa (IDA & IBRD countries)SudanSurinameSwazilandSwedenSwitzerlandSyrian Arab RepublicTajikistanTanzaniaThailandTogoTongaTrinidad and TobagoTunisiaTurkeyTuvaluUgandaUkraineUnited KingdomUnited StatesUpper middle incomeUruguayVanuatuVenezuela, RBWest Bank and GazaWorldYemen, Rep.ZambiaZimbabwe La ligne de temps
Cette échelle de temps montre un graphique de 1978 année à 2016 année Switzerland. Les données jusqu'à 1977 année ne sont pas présentés. Quantité d'observations actuelles selon dates: 39.
Source (désignation):
Les indicateurs du développement mondiale
Source (organisation):
International Monetary Fund, Balance of Payments Statistics Yearbook and data files.
Catégories:
Economy & Growth, Infrastructure, Trade
Dernière mise à jour
23 avr. 2017
Les indicateurs de changement de valeurs selon les années
Minimum:
15.099
1 janv. 1992
Maximum:
33.733
1 janv. 1983
Pour la date d''observation
Valeur
Changement absolu
Le changement par rapport à la valeur précédente
1 janv. 1978
31.226
+31.226
0.0%
1 janv. 1979
32.102
+0.876
2.81%
1 janv. 1980
32.404
+0.302
0.94%
1 janv. 1981
30.47
-1.934
-5.97%
1 janv. 1982
32.184
+1.714
5.63%
1 janv. 1983
33.733
+1.549
4.81%
1 janv. 1984
25.185
-8.548
-25.34%
1 janv. 1985
24.742
-0.444
-1.76%
1 janv. 1986
26.088
+1.347
5.44%
1 janv. 1987
25.319
-0.769
-2.95%
1 janv. 1988
25.581
+0.262
1.03%
1 janv. 1989
26.295
+0.714
2.79%
1 janv. 1990
15.79
-10.504
-39.95%
1 janv. 1991
15.673
-0.118
-0.75%
1 janv. 1992
15.099
-0.574
-3.66%
1 janv. 1993
15.54
+0.44
2.92%
1 janv. 1994
15.838
+0.298
1.92%
1 janv. 1995
16.48
+0.642
4.06%
1 janv. 1996
15.905
-0.575
-3.49%
1 janv. 1997
15.295
-0.61
-3.84%
1 janv. 1998
16.09
+0.794
5.19%
1 janv. 1999
16.351
+0.261
1.62%
1 janv. 2000
17.363
+1.012
6.19%
1 janv. 2001
18.404
+1.041
5.99%
1 janv. 2002
19.195
+0.792
4.3%
1 janv. 2003
20.243
+1.048
5.46%
1 janv. 2004
20.057
-0.186
-0.92%
1 janv. 2005
20.626
+0.569
2.84%
1 janv. 2006
19.757
-0.868
-4.21%
1 janv. 2007
19.122
-0.635
-3.21%
1 janv. 2008
17.938
-1.185
-6.19%
1 janv. 2009
18.449
+0.511
2.85%
1 janv. 2010
19.549
+1.1
5.96%
1 janv. 2011
21.477
+1.928
9.86%
1 janv. 2012
22.451
+0.974
4.53%
1 janv. 2013
24.435
+1.984
8.84%
1 janv. 2014
24.155
-0.279
-1.14%
1 janv. 2015
27.15
+2.994
12.4%
1 janv. 2016
29.385
+2.236
8.23%
Classement des pays selon les statistiques actuelles par années


Commentaires: