29
/fr/
fr
AIzaSyAYiBZKx7MnpbEhh9jyipgxe19OcubqV5w
April 1, 2024
257232
Switzerland
CHE
true
2
1
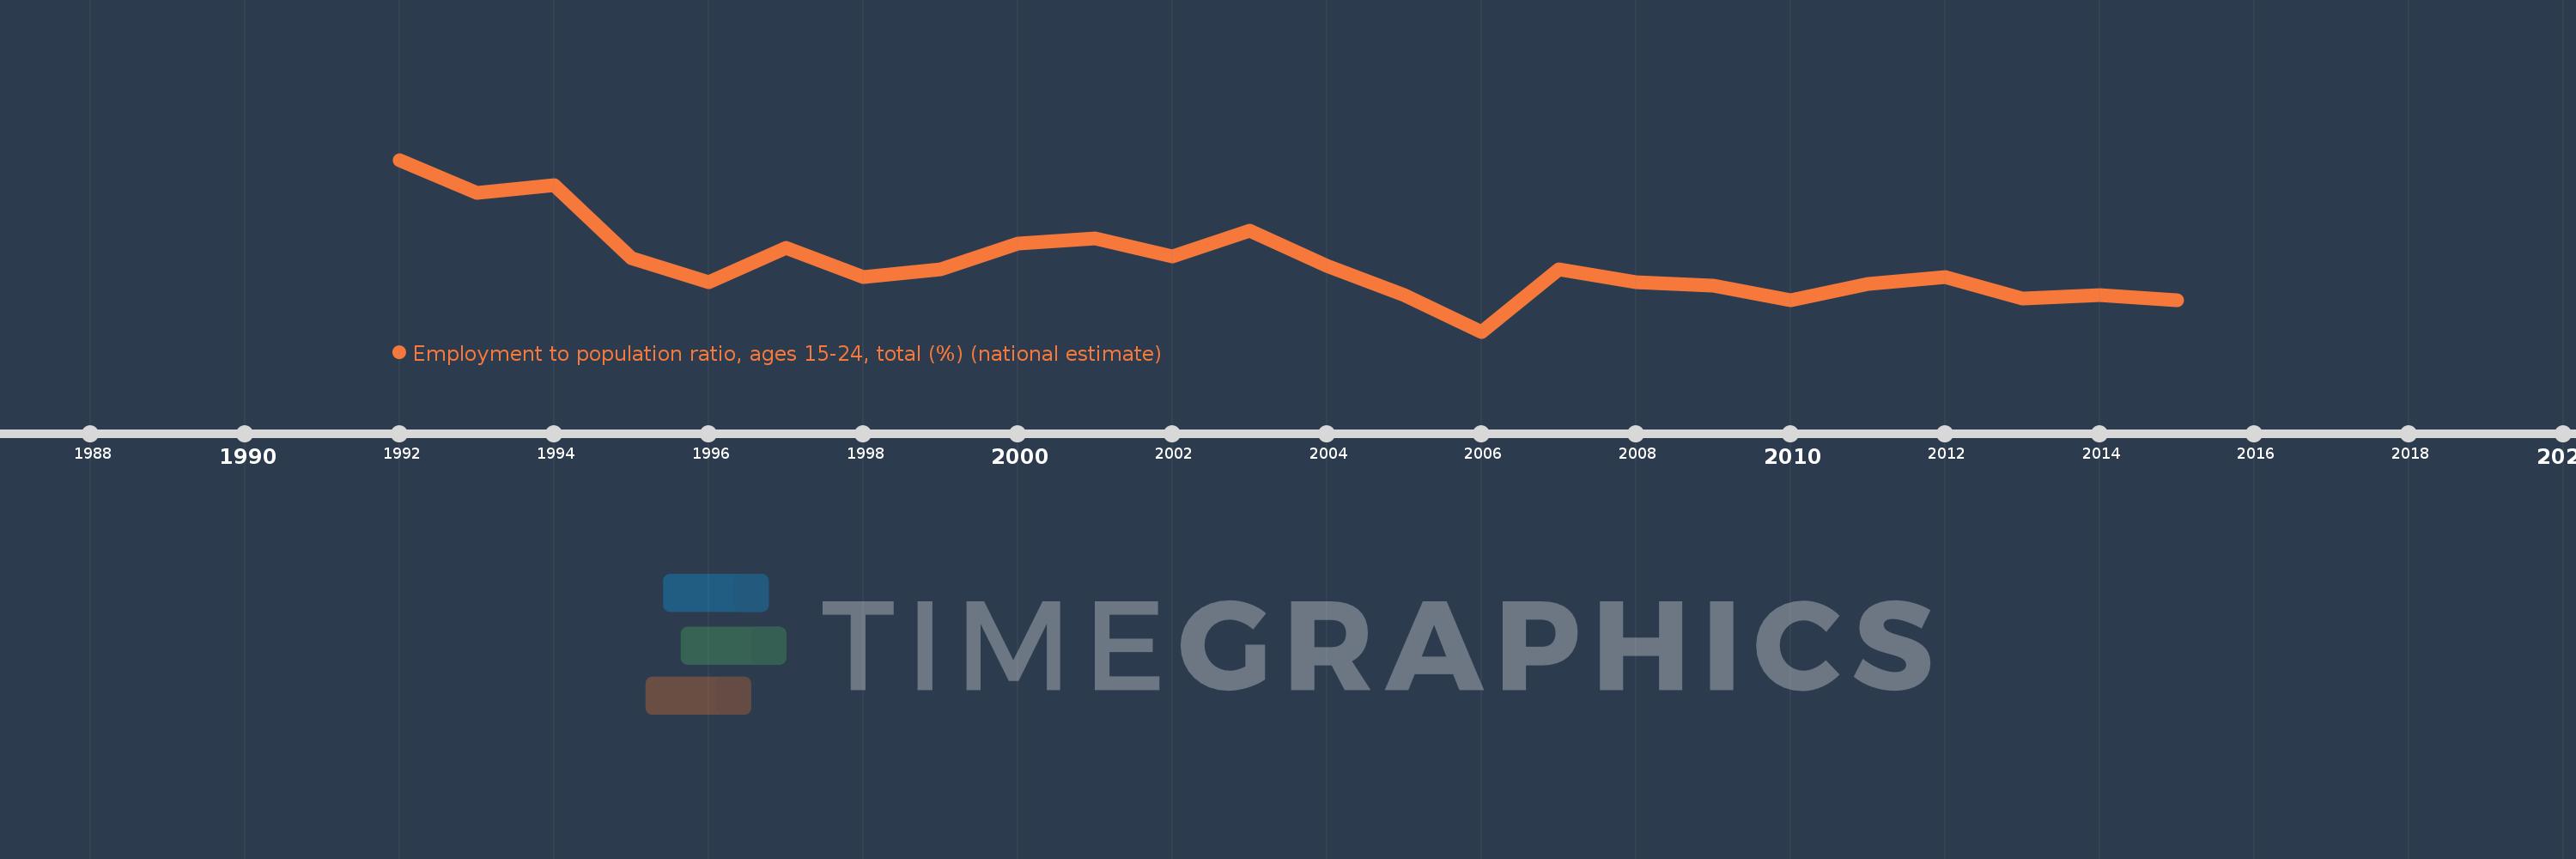
Employment to population ratio, ages 15-24, total (%) (national estimate)
2015,2014,2013,2012,2011,2010,2009,2008,2007,2006,2005,2004,2003,2002,2001,2000,1999,1998,1997,1996,1995,1994,1993,1992
Cette statistique dans les autres pays:
La ligne de temps
Cette échelle de temps montre un graphique de 1992 année à 2015 année Switzerland. Les données jusqu'à 1991 année ne sont pas présentés. Quantité d'observations actuelles selon dates: 24.
Source (désignation):
Les indicateurs du développement mondiale
Source (organisation):
International Labour Organization, Key Indicators of the Labour Market database.
Catégories:
Social Protection & Labor
Dernière mise à jour
23 avr. 2017
Les indicateurs de changement de valeurs selon les années
Pour la date d''observation
Valeur
Changement absolu
Le changement par rapport à la valeur précédente
1 janv. 1992
69.3
+69.3
0.0%
1 janv. 1993
67.5
-1.8
-2.6%
1 janv. 1994
67.9
+0.4
0.59%
1 janv. 1995
63.9
-4.0
-5.89%
1 janv. 1996
62.6
-1.3
-2.03%
1 janv. 1997
64.5
+1.9
3.04%
1 janv. 1998
62.9
-1.6
-2.48%
1 janv. 1999
63.3
+0.4
0.64%
1 janv. 2000
64.7
+1.4
2.21%
1 janv. 2001
65.0
+0.3
0.46%
1 janv. 2002
64.0
-1.0
-1.54%
1 janv. 2003
65.4
+1.4
2.19%
1 janv. 2004
63.5
-1.9
-2.91%
1 janv. 2005
61.9
-1.6
-2.52%
1 janv. 2006
59.9
-2.0
-3.23%
1 janv. 2007
63.3
+3.4
5.68%
1 janv. 2008
62.6
-0.7
-1.11%
1 janv. 2009
62.4
-0.2
-0.32%
1 janv. 2010
61.6
-0.8
-1.28%
1 janv. 2011
62.5
+0.9
1.46%
1 janv. 2012
62.9
+0.4
0.64%
1 janv. 2013
61.7
-1.2
-1.91%
1 janv. 2014
61.9
+0.2
0.32%
1 janv. 2015
61.6
-0.3
-0.48%
Classement des pays selon les statistiques actuelles par années


Commentaires: