29
/fr/
fr
AIzaSyAYiBZKx7MnpbEhh9jyipgxe19OcubqV5w
April 1, 2024
25605
Central Europe and the Baltics
CEB
false
2
1
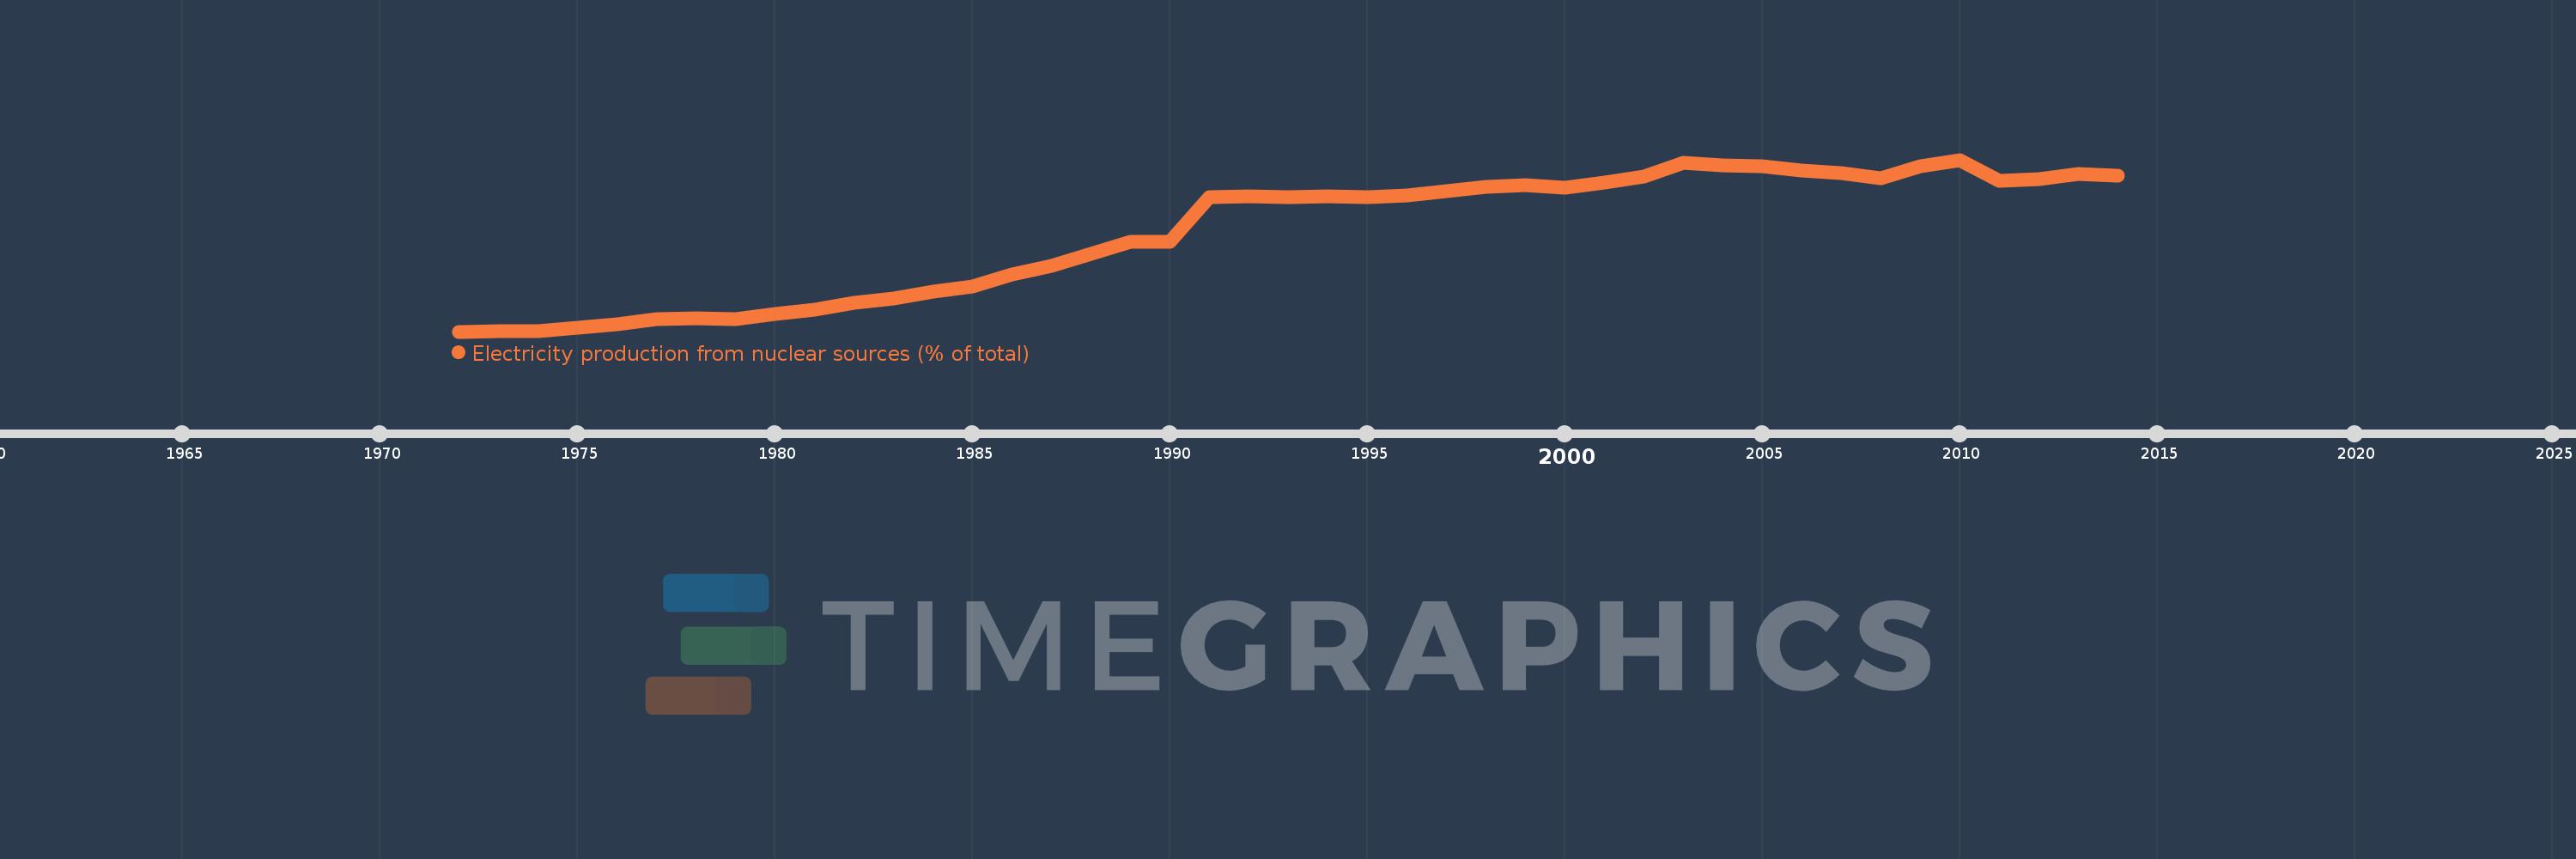
Electricity production from nuclear sources (% of total)
2014,2013,2012,2011,2010,2009,2008,2007,2006,2005,2004,2003,2002,2001,2000,1999,1998,1997,1996,1995,1994,1993,1992,1991,1990,1989,1988,1987,1986,1985,1984,1983,1982,1981,1980,1979,1978,1977,1976,1975,1974,1973,1972
Cette statistique dans les autres pays:
AlbaniaAlgeriaAngolaArab WorldArgentinaArmeniaAustraliaAustriaAzerbaijanBahrainBangladeshBelarusBelgiumBeninBoliviaBosnia and HerzegovinaBotswanaBrazilBrunei DarussalamBulgariaCambodiaCameroonCanadaCentral Europe and the BalticsChileChinaColombiaCongo, Dem. Rep.Congo, Rep.Costa RicaCote d'IvoireCroatiaCubaCuracaoCyprusCzech RepublicDenmarkDominican RepublicEarly-demographic dividendEast Asia & PacificEast Asia & Pacific (excluding high income)East Asia & Pacific (IDA & IBRD countries)EcuadorEgypt, Arab Rep.El SalvadorEritreaEstoniaEthiopiaEuro areaEurope & Central AsiaEurope & Central Asia (excluding high income)Europe & Central Asia (IDA & IBRD countries)European UnionFinlandFragile and conflict affected situationsFranceGabonGeorgiaGermanyGhanaGibraltarGreeceGuatemalaHaitiHeavily indebted poor countries (HIPC)High incomeHondurasHong Kong SAR, ChinaHungaryIBRD onlyIcelandIDA & IBRD totalIDA blendIDA onlyIDA totalIndiaIndonesiaIran, Islamic Rep.IraqIrelandIsraelItalyJamaicaJapanJordanKazakhstanKenyaKorea, Dem. People’s Rep.Korea, Rep.KosovoKuwaitKyrgyz RepublicLate-demographic dividendLatin America & Caribbean Latin America & Caribbean (excluding high income)Latin America & the Caribbean (IDA & IBRD countries)LatviaLeast developed countries: UN classificationLebanonLibyaLithuaniaLow & middle incomeLower middle incomeLuxembourgMacedonia, FYRMalaysiaMaltaMauritiusMexicoMiddle East & North AfricaMiddle East & North Africa (excluding high income)Middle East & North Africa (IDA & IBRD countries)Middle incomeMoldovaMongoliaMontenegroMoroccoMozambiqueMyanmarNamibiaNepalNetherlandsNew ZealandNicaraguaNigerNigeriaNorth AmericaNorwayOECD membersOmanOther small statesPakistanPanamaParaguayPeruPhilippinesPolandPortugalPost-demographic dividendPre-demographic dividendQatarRomaniaRussian FederationSaudi ArabiaSenegalSerbiaSingaporeSlovak RepublicSloveniaSmall statesSouth AfricaSouth AsiaSouth Asia (IDA & IBRD)South SudanSpainSri LankaSub-Saharan Africa Sub-Saharan Africa (excluding high income)Sub-Saharan Africa (IDA & IBRD countries)SudanSwedenSwitzerlandSyrian Arab RepublicTajikistanTanzaniaThailandTogoTrinidad and TobagoTunisiaTurkeyTurkmenistanUkraineUnited Arab EmiratesUnited KingdomUnited StatesUpper middle incomeUruguayUzbekistanVenezuela, RBVietnamWorldYemen, Rep.ZambiaZimbabwe La ligne de temps
Cette échelle de temps montre un graphique de 1972 année à 2014 année Central Europe and the Baltics. Les données jusqu'à 1971 année ne sont pas présentés. Quantité d'observations actuelles selon dates: 43.
Source (désignation):
Les indicateurs du développement mondiale
Source (organisation):
IEA Statistics © OECD/IEA 2014 (http://www.iea.org/stats/index.asp), subject to https://www.iea.org/t&c/termsandconditions/
Catégories:
Energy & Mining, Climate Change, Infrastructure
Dernière mise à jour
23 avr. 2017
Les indicateurs de changement de valeurs selon les années
Maximum:
22.152
1 janv. 2010
Pour la date d''observation
Valeur
Changement absolu
Le changement par rapport à la valeur précédente
1 janv. 1973
0.001
+0.001
%
1 janv. 1974
0.086
+0.085
7.14 milles%
1 janv. 1975
0.493
+0.407
472.65%
1 janv. 1976
0.89
+0.397
80.69%
1 janv. 1977
1.642
+0.752
84.45%
1 janv. 1978
1.725
+0.084
5.1%
1 janv. 1979
1.61
-0.115
-6.69%
1 janv. 1980
2.252
+0.642
39.89%
1 janv. 1981
2.773
+0.521
23.12%
1 janv. 1982
3.708
+0.935
33.74%
1 janv. 1983
4.232
+0.524
14.13%
1 janv. 1984
5.177
+0.944
22.31%
1 janv. 1985
5.862
+0.686
13.25%
1 janv. 1986
7.315
+1.453
24.78%
1 janv. 1987
8.427
+1.112
15.2%
1 janv. 1988
10.067
+1.64
19.46%
1 janv. 1989
11.568
+1.502
14.92%
1 janv. 1990
11.528
-0.04
-0.35%
1 janv. 1991
17.348
+5.82
50.48%
1 janv. 1992
17.484
+0.136
0.79%
1 janv. 1993
17.292
-0.192
-1.1%
1 janv. 1994
17.499
+0.207
1.2%
1 janv. 1995
17.318
-0.181
-1.03%
1 janv. 1996
17.578
+0.259
1.5%
1 janv. 1997
18.102
+0.525
2.99%
1 janv. 1998
18.67
+0.568
3.14%
1 janv. 1999
18.914
+0.244
1.31%
1 janv. 2000
18.58
-0.334
-1.77%
1 janv. 2001
19.18
+0.6
3.23%
1 janv. 2002
20.029
+0.849
4.43%
1 janv. 2003
21.81
+1.782
8.9%
1 janv. 2004
21.465
-0.346
-1.58%
1 janv. 2005
21.314
-0.151
-0.7%
1 janv. 2006
20.809
-0.505
-2.37%
1 janv. 2007
20.438
-0.372
-1.79%
1 janv. 2008
19.739
-0.699
-3.42%
1 janv. 2009
21.357
+1.618
8.2%
1 janv. 2010
22.152
+0.795
3.72%
1 janv. 2011
19.386
-2.766
-12.49%
1 janv. 2012
19.669
+0.284
1.46%
1 janv. 2013
20.279
+0.61
3.1%
1 janv. 2014
20.054
-0.225
-1.11%
Classement des pays selon les statistiques actuelles par années


Commentaires: