29
/fr/
fr
AIzaSyAYiBZKx7MnpbEhh9jyipgxe19OcubqV5w
April 1, 2024
25517
Central Europe and the Baltics
CEB
false
2
1
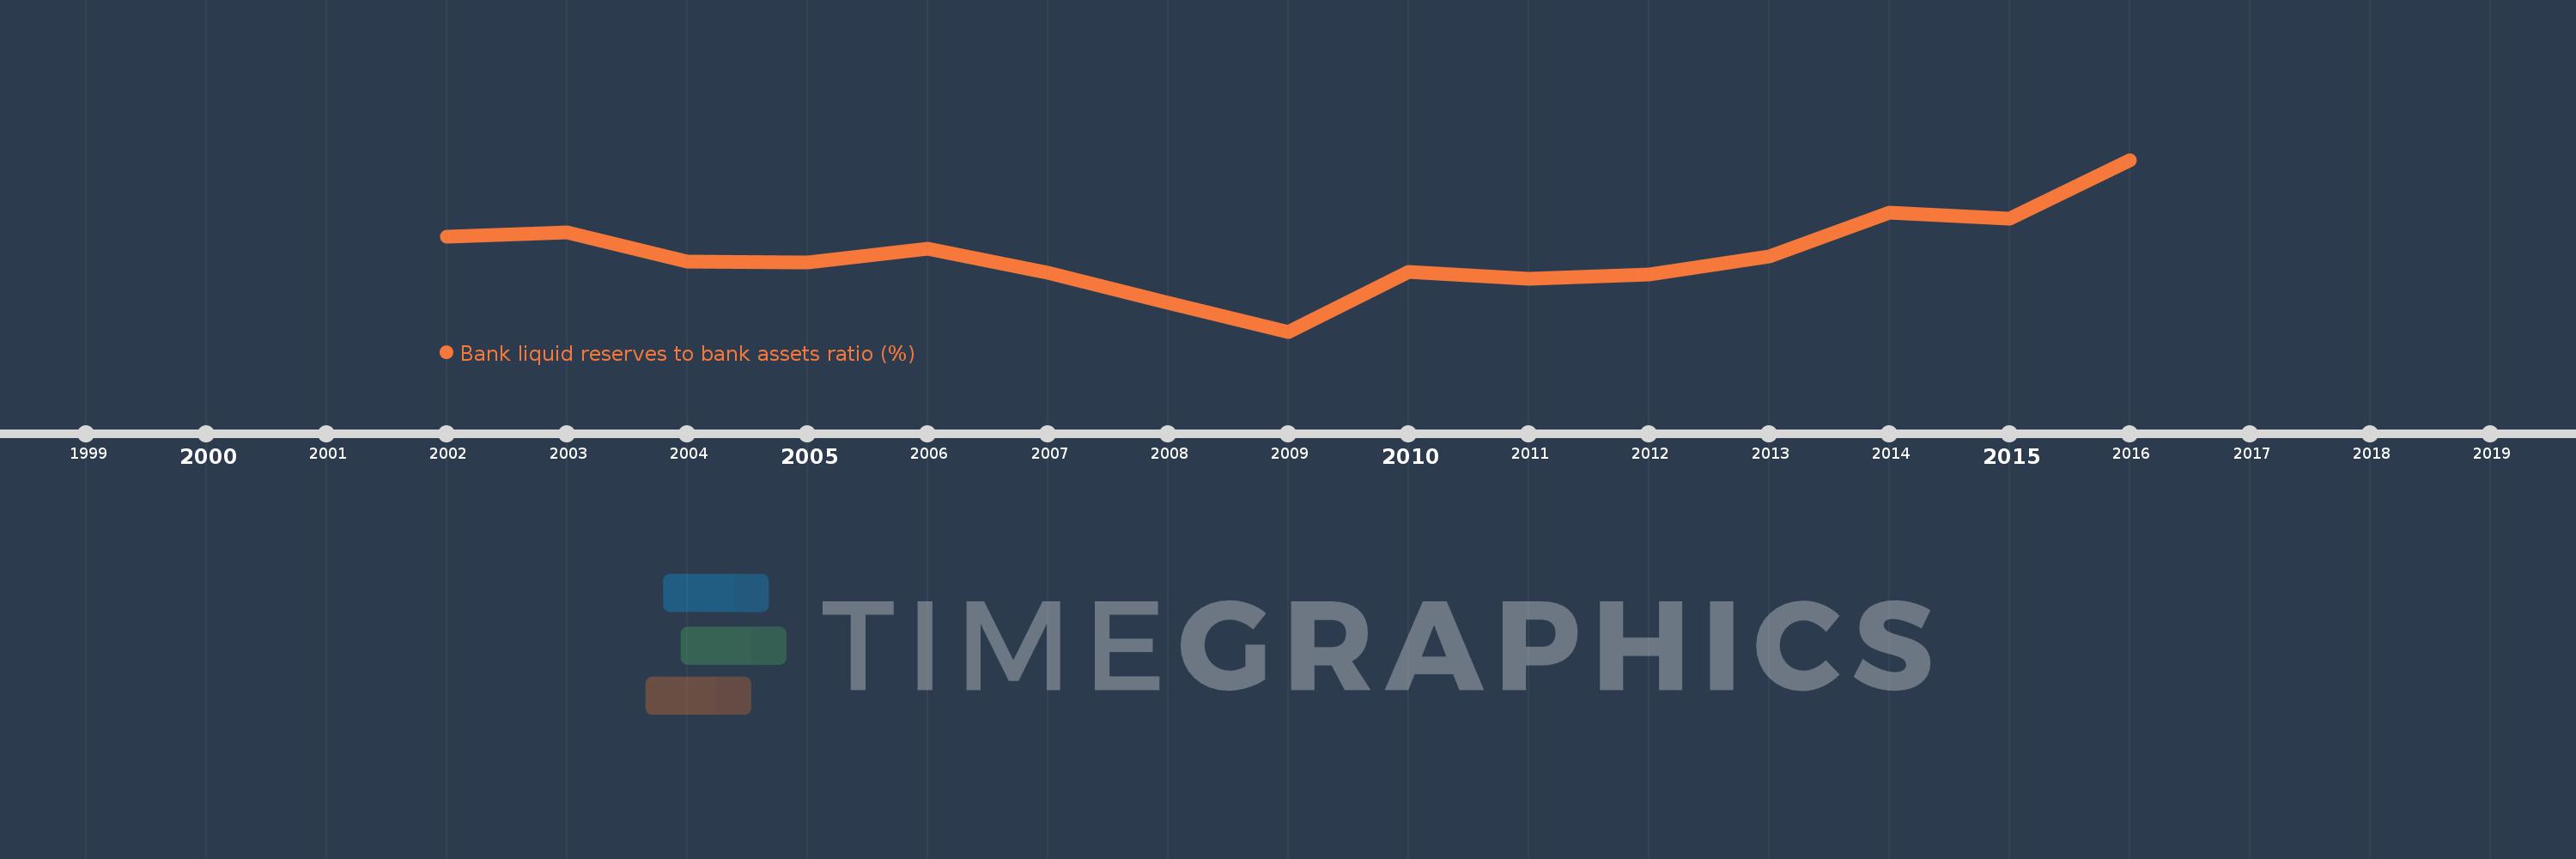
Bank liquid reserves to bank assets ratio (%)
2016,2015,2014,2013,2012,2011,2010,2009,2008,2007,2006,2005,2004,2003,2002
Cette statistique dans les autres pays:
La ligne de temps
Cette échelle de temps montre un graphique de 2002 année à 2016 année Central Europe and the Baltics. Les données jusqu'à 2001 année ne sont pas présentés. Quantité d'observations actuelles selon dates: 15.
Source (désignation):
Les indicateurs du développement mondiale
Source (organisation):
International Monetary Fund, International Financial Statistics and data files.
Catégories:
Financial Sector
Dernière mise à jour
23 avr. 2017
Les indicateurs de changement de valeurs selon les années
Minimum:
11.307
1 janv. 2009
Maximum:
24.085
1 janv. 2016
Pour la date d''observation
Valeur
Changement absolu
Le changement par rapport à la valeur précédente
1 janv. 2002
18.353
+18.353
0.0%
1 janv. 2003
18.716
+0.364
1.98%
1 janv. 2004
16.493
-2.224
-11.88%
1 janv. 2005
16.428
-0.065
-0.39%
1 janv. 2006
17.464
+1.036
6.31%
1 janv. 2007
15.698
-1.766
-10.11%
1 janv. 2008
13.477
-2.22
-14.14%
1 janv. 2009
11.307
-2.17
-16.1%
1 janv. 2010
15.762
+4.455
39.4%
1 janv. 2011
15.224
-0.538
-3.41%
1 janv. 2012
15.524
+0.3
1.97%
1 janv. 2013
16.875
+1.351
8.71%
1 janv. 2014
20.157
+3.282
19.45%
1 janv. 2015
19.707
-0.45
-2.23%
1 janv. 2016
24.085
+4.378
22.21%
Classement des pays selon les statistiques actuelles par années


Commentaires: