29
/fr/
fr
AIzaSyAYiBZKx7MnpbEhh9jyipgxe19OcubqV5w
April 1, 2024
253708
Sudan
SDN
true
2
1
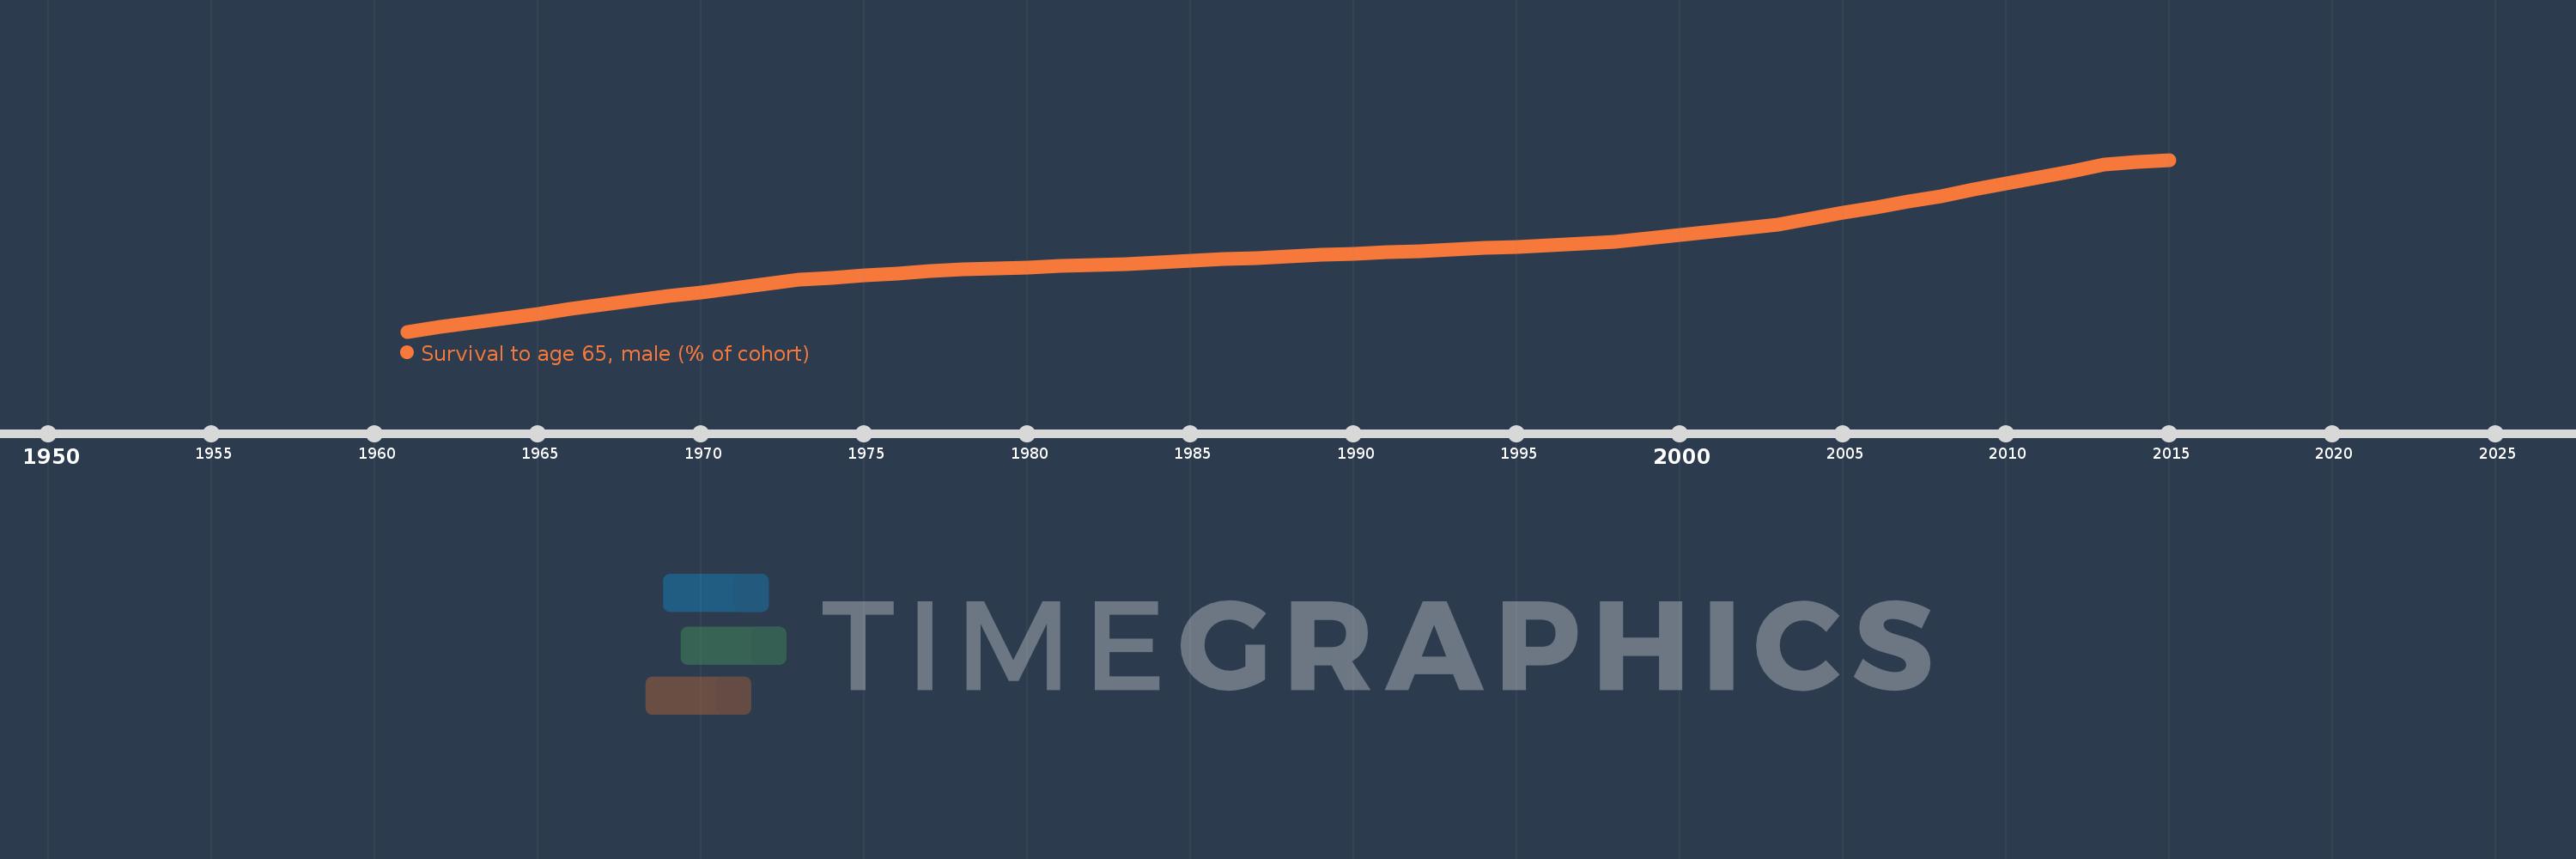
Survival to age 65, male (% of cohort)
2015,2014,2013,2012,2011,2010,2009,2008,2007,2006,2005,2004,2003,2002,2001,2000,1999,1998,1997,1996,1995,1994,1993,1992,1991,1990,1989,1988,1987,1986,1985,1984,1983,1982,1981,1980,1979,1978,1977,1976,1975,1974,1973,1972,1971,1970,1969,1968,1967,1966,1965,1964,1963,1962,1961
Cette statistique dans les autres pays:
AfghanistanAlbaniaAlgeriaAngolaAntigua and BarbudaArab WorldArgentinaArmeniaArubaAustraliaAustriaAzerbaijanBahamas, TheBahrainBangladeshBarbadosBelarusBelgiumBelizeBeninBhutanBoliviaBosnia and HerzegovinaBotswanaBrazilBrunei DarussalamBulgariaBurkina FasoBurundiCabo VerdeCambodiaCameroonCanadaCaribbean small statesCentral African RepublicCentral Europe and the BalticsChadChannel IslandsChileChinaColombiaComorosCongo, Dem. Rep.Congo, Rep.Costa RicaCote d'IvoireCroatiaCubaCuracaoCyprusCzech RepublicDenmarkDjiboutiDominican RepublicEarly-demographic dividendEast Asia & PacificEast Asia & Pacific (excluding high income)East Asia & Pacific (IDA & IBRD countries)EcuadorEgypt, Arab Rep.El SalvadorEquatorial GuineaEritreaEstoniaEthiopiaEuro areaEurope & Central AsiaEurope & Central Asia (excluding high income)Europe & Central Asia (IDA & IBRD countries)European UnionFijiFinlandFragile and conflict affected situationsFranceFrench PolynesiaGabonGambia, TheGeorgiaGermanyGhanaGreeceGrenadaGuamGuatemalaGuineaGuinea-BissauGuyanaHaitiHeavily indebted poor countries (HIPC)High incomeHondurasHong Kong SAR, ChinaHungaryIBRD onlyIcelandIDA & IBRD totalIDA blendIDA onlyIDA totalIndiaIndonesiaIran, Islamic Rep.IraqIrelandIsraelItalyJamaicaJapanJordanKazakhstanKenyaKiribatiKorea, Dem. People’s Rep.Korea, Rep.KuwaitKyrgyz RepublicLao PDRLate-demographic dividendLatin America & Caribbean Latin America & Caribbean (excluding high income)Latin America & the Caribbean (IDA & IBRD countries)LatviaLeast developed countries: UN classificationLebanonLesothoLiberiaLibyaLithuaniaLow & middle incomeLow incomeLower middle incomeLuxembourgMacao SAR, ChinaMacedonia, FYRMadagascarMalawiMalaysiaMaldivesMaliMaltaMauritaniaMauritiusMexicoMicronesia, Fed. Sts.Middle East & North AfricaMiddle East & North Africa (excluding high income)Middle East & North Africa (IDA & IBRD countries)Middle incomeMoldovaMongoliaMontenegroMoroccoMozambiqueMyanmarNamibiaNepalNetherlandsNew CaledoniaNew ZealandNicaraguaNigerNigeriaNorth AmericaNorwayOECD membersOmanOther small statesPacific island small statesPakistanPanamaPapua New GuineaParaguayPeruPhilippinesPolandPortugalPost-demographic dividendPre-demographic dividendPuerto RicoQatarRomaniaRussian FederationRwandaSamoaSao Tome and PrincipeSaudi ArabiaSenegalSerbiaSeychellesSierra LeoneSingaporeSlovak RepublicSloveniaSmall statesSolomon IslandsSomaliaSouth AfricaSouth AsiaSouth Asia (IDA & IBRD)South SudanSpainSri LankaSt. LuciaSt. Vincent and the GrenadinesSub-Saharan Africa Sub-Saharan Africa (excluding high income)Sub-Saharan Africa (IDA & IBRD countries)SudanSurinameSwazilandSwedenSwitzerlandSyrian Arab RepublicTajikistanTanzaniaThailandTimor-LesteTogoTongaTrinidad and TobagoTunisiaTurkeyTurkmenistanUgandaUkraineUnited Arab EmiratesUnited KingdomUnited StatesUpper middle incomeUruguayUzbekistanVanuatuVenezuela, RBVietnamVirgin Islands (U.S.)West Bank and GazaWorldYemen, Rep.ZambiaZimbabwe La ligne de temps
Cette échelle de temps montre un graphique de 1961 année à 2015 année Sudan. Les données jusqu'à 1960 année ne sont pas présentés. Quantité d'observations actuelles selon dates: 55.
Source (désignation):
Les indicateurs du développement mondiale
Source (organisation):
United Nations Population Division. World Population Prospects. New York, United Nations, Department of Economic and Social Affairs (advanced Excel tables). Available at http://esa.un.org/wpp/unpp/panel_population.htm.
Catégories:
Health, Gender
Dernière mise à jour
23 avr. 2017
Les indicateurs de changement de valeurs selon les années
Minimum:
38.992
1 janv. 1961
Maximum:
60.374
1 janv. 2015
Pour la date d''observation
Valeur
Changement absolu
Le changement par rapport à la valeur précédente
1 janv. 1961
38.992
+38.992
0.0%
1 janv. 1962
39.558
+0.565
1.45%
1 janv. 1963
40.123
+0.565
1.43%
1 janv. 1964
40.678
+0.555
1.38%
1 janv. 1965
41.233
+0.555
1.36%
1 janv. 1966
41.788
+0.555
1.35%
1 janv. 1967
42.343
+0.555
1.33%
1 janv. 1968
42.898
+0.555
1.31%
1 janv. 1969
43.402
+0.504
1.18%
1 janv. 1970
43.906
+0.504
1.16%
1 janv. 1971
44.411
+0.504
1.15%
1 janv. 1972
44.915
+0.504
1.14%
1 janv. 1973
45.419
+0.504
1.12%
1 janv. 1974
45.683
+0.265
0.58%
1 janv. 1975
45.948
+0.265
0.58%
1 janv. 1976
46.213
+0.265
0.58%
1 janv. 1977
46.477
+0.265
0.57%
1 janv. 1978
46.742
+0.265
0.57%
1 janv. 1979
46.876
+0.134
0.29%
1 janv. 1980
47.01
+0.134
0.29%
1 janv. 1981
47.145
+0.134
0.29%
1 janv. 1982
47.279
+0.134
0.28%
1 janv. 1983
47.413
+0.134
0.28%
1 janv. 1984
47.605
+0.191
0.4%
1 janv. 1985
47.796
+0.191
0.4%
1 janv. 1986
47.987
+0.191
0.4%
1 janv. 1987
48.179
+0.191
0.4%
1 janv. 1988
48.37
+0.191
0.4%
1 janv. 1989
48.536
+0.166
0.34%
1 janv. 1990
48.702
+0.166
0.34%
1 janv. 1991
48.868
+0.166
0.34%
1 janv. 1992
49.034
+0.166
0.34%
1 janv. 1993
49.2
+0.166
0.34%
1 janv. 1994
49.388
+0.188
0.38%
1 janv. 1995
49.576
+0.188
0.38%
1 janv. 1996
49.764
+0.188
0.38%
1 janv. 1997
49.953
+0.188
0.38%
1 janv. 1998
50.141
+0.188
0.38%
1 janv. 1999
50.579
+0.439
0.87%
1 janv. 2000
51.018
+0.439
0.87%
1 janv. 2001
51.456
+0.439
0.86%
1 janv. 2002
51.895
+0.439
0.85%
1 janv. 2003
52.333
+0.439
0.85%
1 janv. 2004
53.042
+0.709
1.35%
1 janv. 2005
53.751
+0.709
1.34%
1 janv. 2006
54.46
+0.709
1.32%
1 janv. 2007
55.169
+0.709
1.3%
1 janv. 2008
55.878
+0.709
1.28%
1 janv. 2009
56.65
+0.772
1.38%
1 janv. 2010
57.422
+0.772
1.36%
1 janv. 2011
58.195
+0.772
1.35%
1 janv. 2012
58.967
+0.772
1.33%
1 janv. 2013
59.739
+0.772
1.31%
1 janv. 2014
60.057
+0.317
0.53%
1 janv. 2015
60.374
+0.317
0.53%
Classement des pays selon les statistiques actuelles par années


Commentaires: