29
/fr/
fr
AIzaSyAYiBZKx7MnpbEhh9jyipgxe19OcubqV5w
April 1, 2024
253395
Sudan
SDN
true
2
1
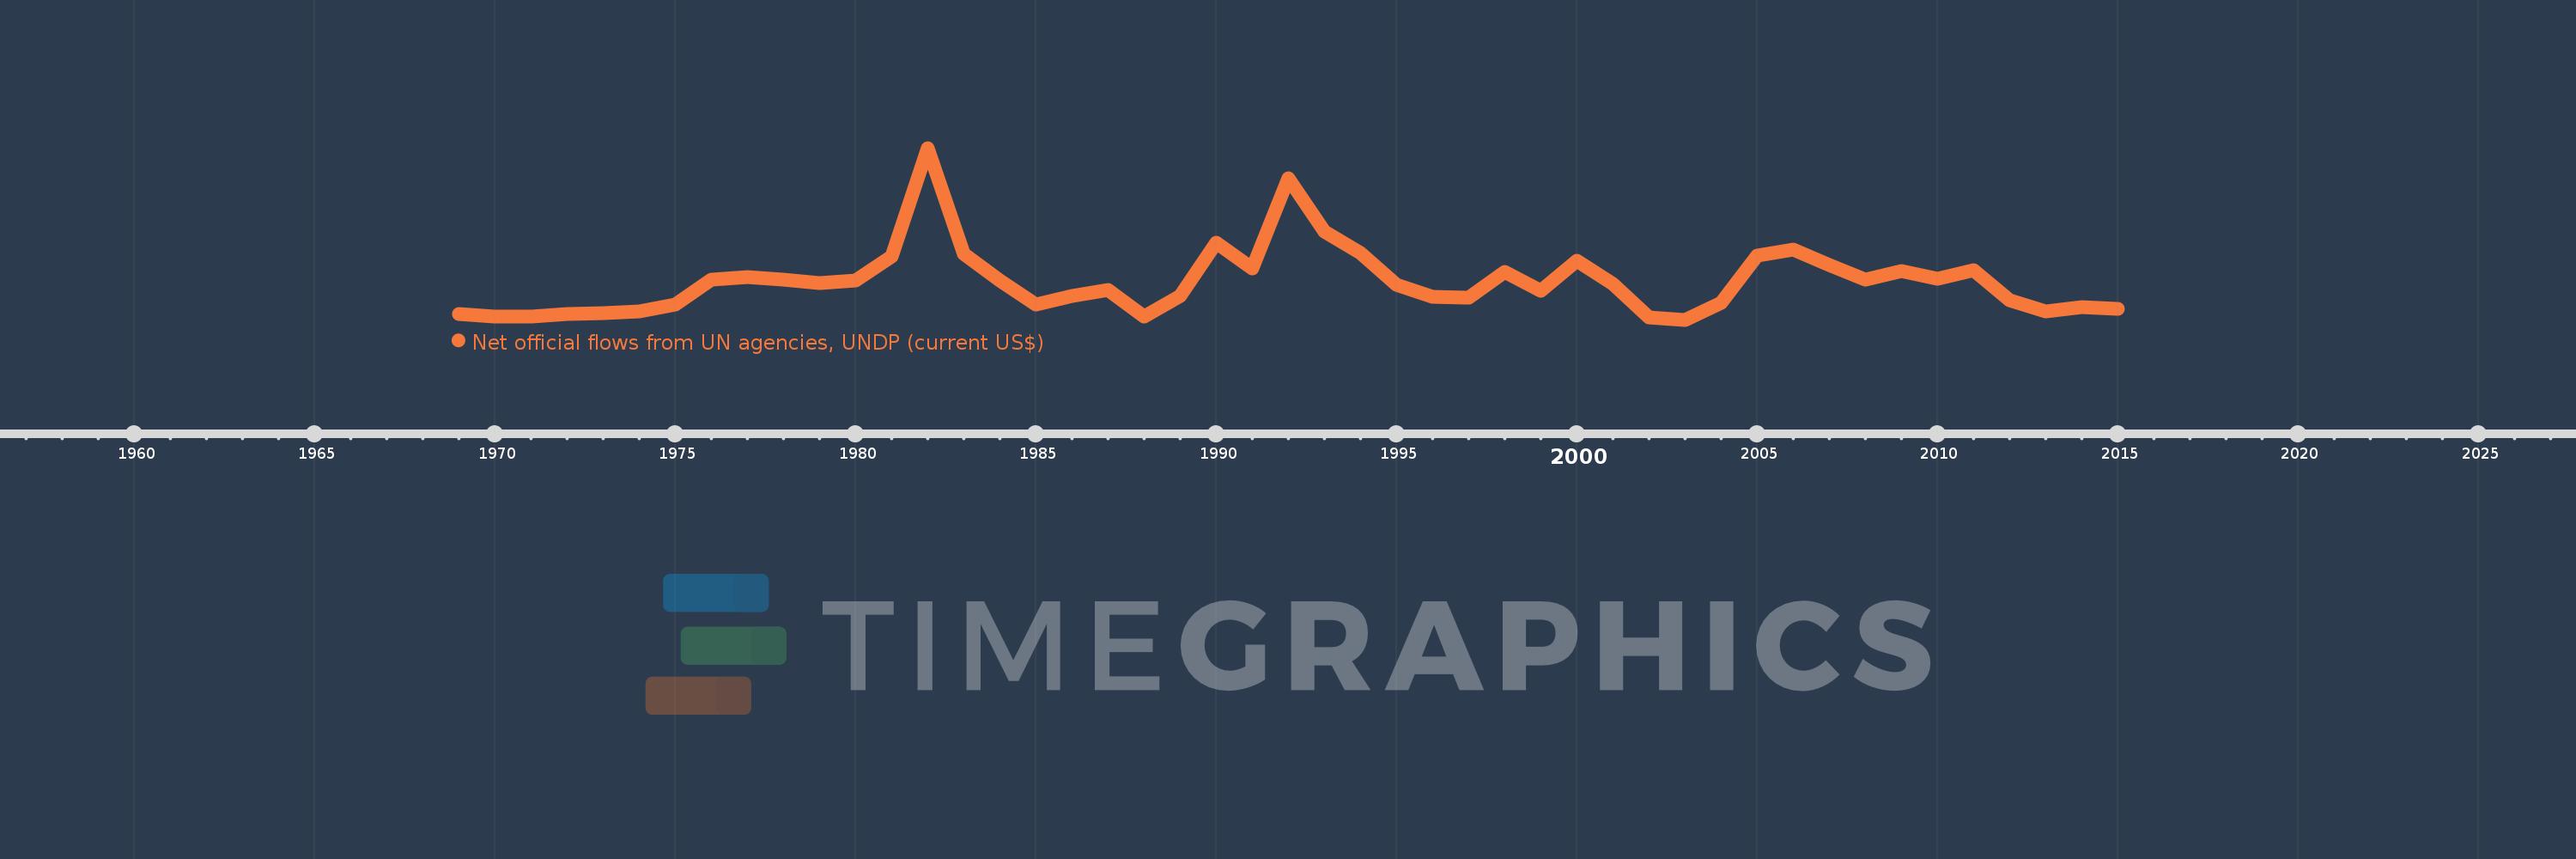
Net official flows from UN agencies, UNDP (current US$)
2015,2014,2013,2012,2011,2010,2009,2008,2007,2006,2005,2004,2003,2002,2001,2000,1999,1998,1997,1996,1995,1994,1993,1992,1991,1990,1989,1988,1987,1986,1985,1984,1983,1982,1981,1980,1979,1978,1977,1976,1975,1974,1973,1972,1971,1970,1969
Cette statistique dans les autres pays:
AfghanistanAlbaniaAlgeriaAngolaAntigua and BarbudaArab WorldArgentinaArmeniaArubaAzerbaijanBahamas, TheBahrainBangladeshBarbadosBelarusBelizeBeninBermudaBhutanBoliviaBosnia and HerzegovinaBotswanaBrazilBritish Virgin IslandsBrunei DarussalamBulgariaBurkina FasoBurundiCabo VerdeCambodiaCameroonCaribbean small statesCayman IslandsCentral African RepublicCentral Europe and the BalticsChadChileChinaColombiaComorosCongo, Dem. Rep.Congo, Rep.Costa RicaCote d'IvoireCroatiaCubaCyprusCzech RepublicDjiboutiDominicaDominican RepublicEast Asia & PacificEast Asia & Pacific (excluding high income)East Asia & Pacific (IDA & IBRD countries)EcuadorEgypt, Arab Rep.El SalvadorEquatorial GuineaEritreaEstoniaEthiopiaEuro areaEurope & Central AsiaEurope & Central Asia (excluding high income)Europe & Central Asia (IDA & IBRD countries)European UnionFijiFragile and conflict affected situationsFrench PolynesiaGabonGambia, TheGeorgiaGhanaGibraltarGrenadaGuatemalaGuineaGuinea-BissauGuyanaHaitiHeavily indebted poor countries (HIPC)High incomeHondurasHong Kong SAR, ChinaHungaryIBRD onlyIDA & IBRD totalIDA blendIDA onlyIDA totalIndiaIndonesiaIran, Islamic Rep.IraqIsraelJamaicaJordanKazakhstanKenyaKiribatiKorea, Dem. People’s Rep.Korea, Rep.KosovoKuwaitKyrgyz RepublicLao PDRLatin America & Caribbean Latin America & Caribbean (excluding high income)Latin America & the Caribbean (IDA & IBRD countries)LatviaLeast developed countries: UN classificationLebanonLesothoLiberiaLibyaLithuaniaLow & middle incomeLow incomeLower middle incomeMacao SAR, ChinaMacedonia, FYRMadagascarMalawiMalaysiaMaldivesMaliMaltaMarshall IslandsMauritaniaMauritiusMexicoMicronesia, Fed. Sts.Middle East & North AfricaMiddle East & North Africa (excluding high income)Middle East & North Africa (IDA & IBRD countries)Middle incomeMoldovaMongoliaMontenegroMoroccoMozambiqueMyanmarNamibiaNauruNepalNew CaledoniaNicaraguaNigerNigeriaNorth AmericaNorthern Mariana IslandsOECD membersOmanOther small statesPacific island small statesPakistanPalauPanamaPapua New GuineaParaguayPeruPhilippinesPolandQatarRomaniaRussian FederationRwandaSamoaSao Tome and PrincipeSaudi ArabiaSenegalSerbiaSeychellesSierra LeoneSingaporeSlovak RepublicSloveniaSmall statesSolomon IslandsSomaliaSouth AfricaSouth AsiaSouth Asia (IDA & IBRD)South SudanSri LankaSt. Kitts and NevisSt. LuciaSt. Vincent and the GrenadinesSub-Saharan Africa Sub-Saharan Africa (excluding high income)Sub-Saharan Africa (IDA & IBRD countries)SudanSurinameSwazilandSyrian Arab RepublicTajikistanTanzaniaThailandTimor-LesteTogoTongaTrinidad and TobagoTunisiaTurkeyTurkmenistanTurks and Caicos IslandsTuvaluUgandaUkraineUnited Arab EmiratesUpper middle incomeUruguayUzbekistanVanuatuVenezuela, RBVietnamWest Bank and GazaWorldYemen, Rep.ZambiaZimbabwe La ligne de temps
Cette échelle de temps montre un graphique de 1969 année à 2015 année Sudan. Les données jusqu'à 1968 année ne sont pas présentés. Quantité d'observations actuelles selon dates: 47.
Source (désignation):
Les indicateurs du développement mondiale
Source (organisation):
Development Assistance Committee of the Organisation for Economic Co-operation and Development, Geographical Distribution of Financial Flows to Developing Countries, Development Co-operation Report, and International Development Statistics database. Data are available online at: www.oecd.org/dac/stats/idsonline.
Catégories:
Aid Effectiveness
Dernière mise à jour
23 avr. 2017
Les indicateurs de changement de valeurs selon les années
Minimum:
1.95 mln.
1 janv. 2003
Maximum:
25.42 mln.
1 janv. 1982
Pour la date d''observation
Valeur
Changement absolu
Le changement par rapport à la valeur précédente
1 janv. 1969
2.72 mln.
+2.72 mln.
0.0%
1 janv. 1970
2.33 mln.
-390.0 milles
-14.34%
1 janv. 1971
2.41 mln.
+80.0 milles
3.43%
1 janv. 1972
2.76 mln.
+350.0 milles
14.52%
1 janv. 1973
2.82 mln.
+60.0 milles
2.17%
1 janv. 1974
3.11 mln.
+290.0 milles
10.28%
1 janv. 1975
4.02 mln.
+910.0 milles
29.26%
1 janv. 1976
7.4 mln.
+3.38 mln.
84.08%
1 janv. 1977
7.76 mln.
+360.0 milles
4.86%
1 janv. 1978
7.46 mln.
-300.0 milles
-3.87%
1 janv. 1979
7.01 mln.
-450.0 milles
-6.03%
1 janv. 1980
7.32 mln.
+310.0 milles
4.42%
1 janv. 1981
10.65 mln.
+3.33 mln.
45.49%
1 janv. 1982
25.42 mln.
+14.77 mln.
138.69%
1 janv. 1983
10.93 mln.
-14.49 mln.
-57.0%
1 janv. 1984
7.27 mln.
-3.66 mln.
-33.49%
1 janv. 1985
4.03 mln.
-3.24 mln.
-44.57%
1 janv. 1986
5.17 mln.
+1.14 mln.
28.29%
1 janv. 1987
6.07 mln.
+900.0 milles
17.41%
1 janv. 1988
2.44 mln.
-3.63 mln.
-59.8%
1 janv. 1989
5.22 mln.
+2.78 mln.
113.93%
1 janv. 1990
12.42 mln.
+7.2 mln.
137.93%
1 janv. 1991
8.97 mln.
-3.45 mln.
-27.78%
1 janv. 1992
21.29 mln.
+12.32 mln.
137.35%
1 janv. 1993
13.99 mln.
-7.3 mln.
-34.29%
1 janv. 1994
11.11 mln.
-2.88 mln.
-20.59%
1 janv. 1995
6.77 mln.
-4.34 mln.
-39.06%
1 janv. 1996
5.06 mln.
-1.71 mln.
-25.26%
1 janv. 1997
5.0 mln.
-60.0 milles
-1.19%
1 janv. 1998
8.54 mln.
+3.54 mln.
70.8%
1 janv. 1999
5.86 mln.
-2.68 mln.
-31.38%
1 janv. 2000
10.05 mln.
+4.19 mln.
71.5%
1 janv. 2001
6.9 mln.
-3.15 mln.
-31.34%
1 janv. 2002
2.22 mln.
-4.68 mln.
-67.83%
1 janv. 2003
1.95 mln.
-270.0 milles
-12.16%
1 janv. 2004
4.32 mln.
+2.37 mln.
121.54%
1 janv. 2005
10.74 mln.
+6.42 mln.
148.61%
1 janv. 2006
11.59 mln.
+850.0 milles
7.91%
1 janv. 2007
9.42 mln.
-2.17 mln.
-18.72%
1 janv. 2008
7.45 mln.
-1.97 mln.
-20.91%
1 janv. 2009
8.55 mln.
+1.1 mln.
14.77%
1 janv. 2010
7.55 mln.
-1000.0 milles
-11.7%
1 janv. 2011
8.73 mln.
+1.18 mln.
15.63%
1 janv. 2012
4.59 mln.
-4.14 mln.
-47.42%
1 janv. 2013
3.14 mln.
-1.45 mln.
-31.59%
1 janv. 2014
3.62 mln.
+480.0 milles
15.29%
1 janv. 2015
3.48 mln.
-140.0 milles
-3.87%
Classement des pays selon les statistiques actuelles par années


Commentaires: