29
/fr/
fr
AIzaSyAYiBZKx7MnpbEhh9jyipgxe19OcubqV5w
April 1, 2024
253174
Sudan
SDN
true
2
1
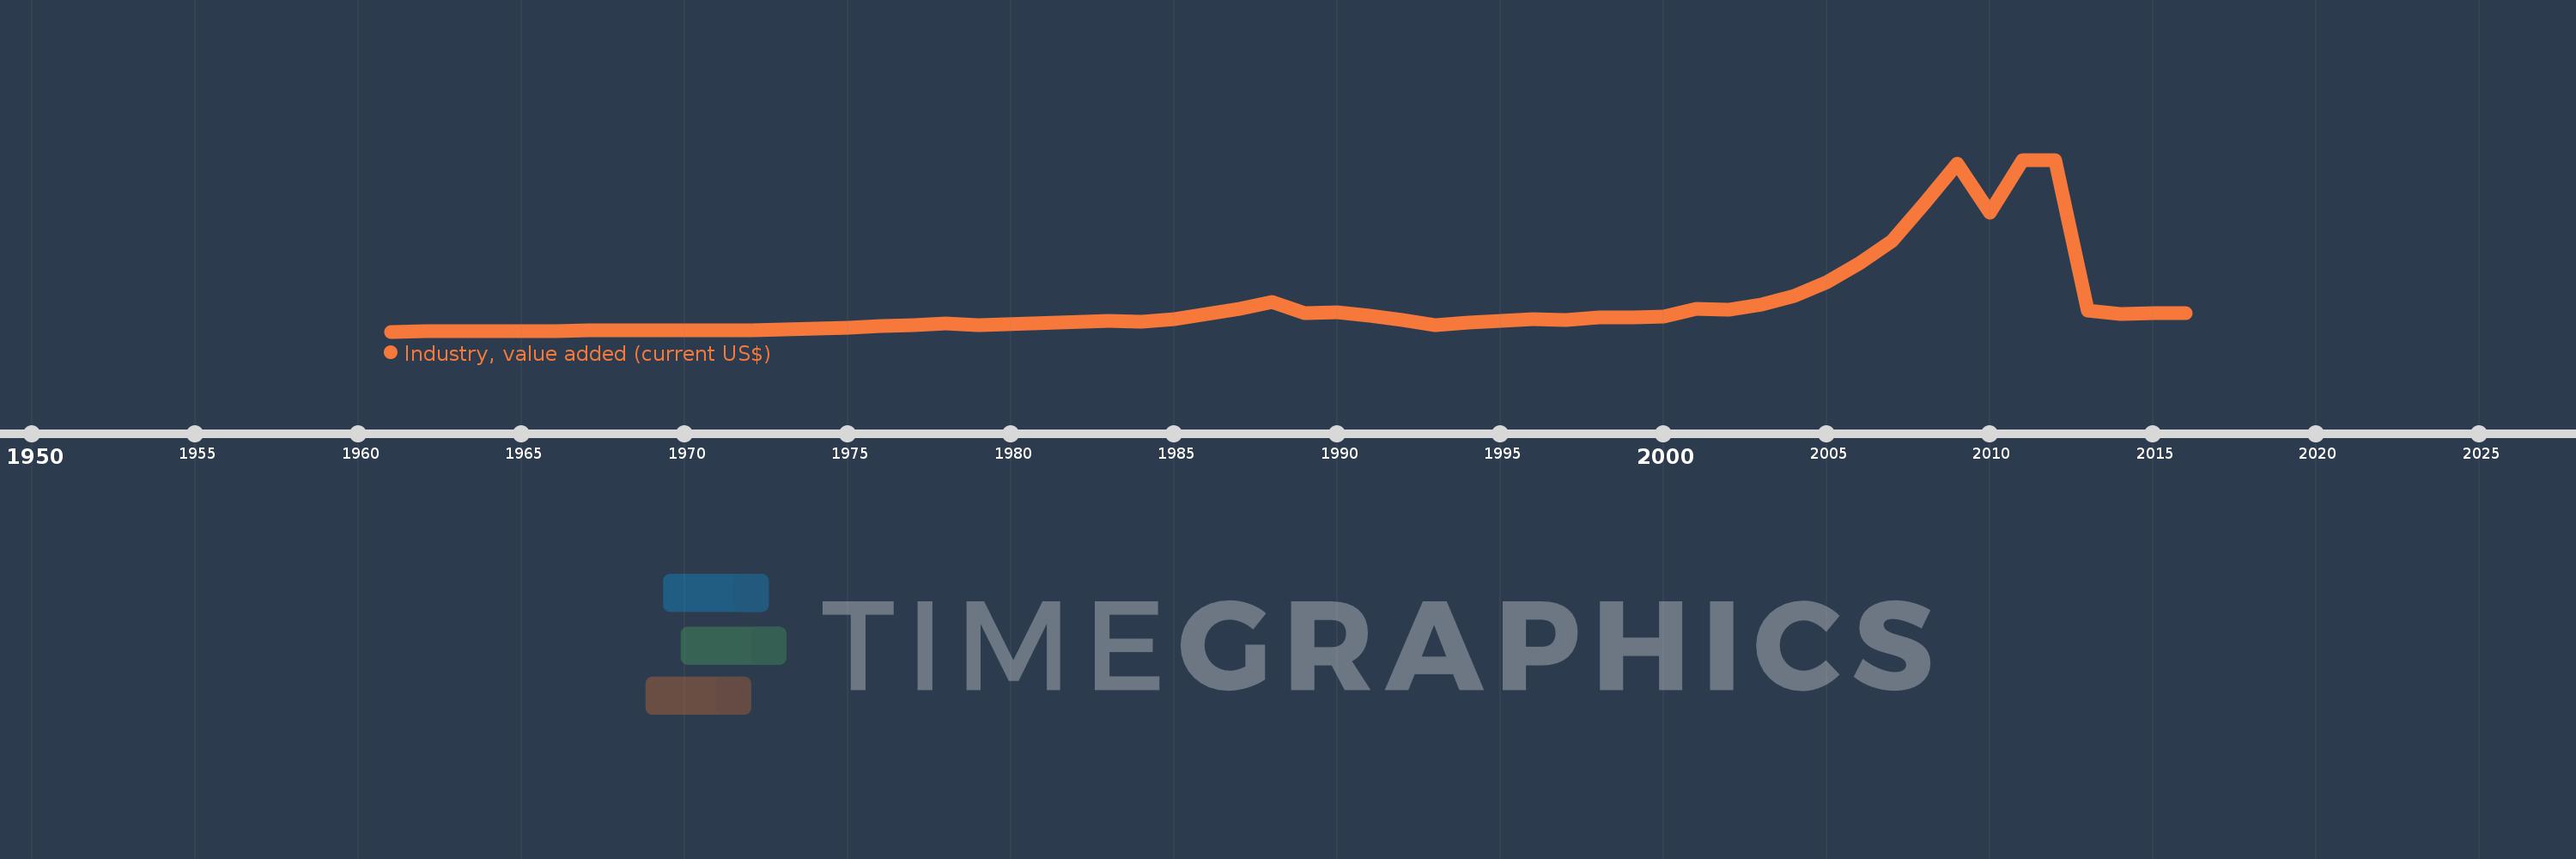
Industry, value added (current US$)
2016,2015,2014,2013,2012,2011,2010,2009,2008,2007,2006,2005,2004,2003,2002,2001,2000,1999,1998,1997,1996,1995,1994,1993,1992,1991,1990,1989,1988,1987,1986,1985,1984,1983,1979,1978,1977,1976,1975,1974,1973,1972,1971,1970,1969,1968,1967,1966,1965,1964,1963,1962,1961
Cette statistique dans les autres pays:
AfghanistanAlbaniaAlgeriaAndorraAngolaAntigua and BarbudaArab WorldArgentinaArmeniaArubaAustraliaAustriaAzerbaijanBahamas, TheBahrainBangladeshBarbadosBelarusBelgiumBelizeBeninBermudaBhutanBoliviaBosnia and HerzegovinaBotswanaBrazilBrunei DarussalamBulgariaBurkina FasoBurundiCabo VerdeCambodiaCameroonCanadaCaribbean small statesCayman IslandsCentral African RepublicCentral Europe and the BalticsChadChileChinaColombiaComorosCongo, Dem. Rep.Congo, Rep.Costa RicaCote d'IvoireCroatiaCubaCyprusCzech RepublicDenmarkDjiboutiDominicaDominican RepublicEarly-demographic dividendEast Asia & PacificEast Asia & Pacific (excluding high income)East Asia & Pacific (IDA & IBRD countries)EcuadorEgypt, Arab Rep.El SalvadorEquatorial GuineaEritreaEstoniaEthiopiaEuro areaEurope & Central AsiaEurope & Central Asia (excluding high income)Europe & Central Asia (IDA & IBRD countries)European UnionFijiFinlandFragile and conflict affected situationsFranceGabonGambia, TheGeorgiaGermanyGhanaGreeceGrenadaGuatemalaGuineaGuinea-BissauGuyanaHeavily indebted poor countries (HIPC)High incomeHondurasHong Kong SAR, ChinaHungaryIBRD onlyIcelandIDA & IBRD totalIDA blendIDA onlyIDA totalIndiaIndonesiaIran, Islamic Rep.IraqIrelandItalyJamaicaJapanJordanKazakhstanKenyaKiribatiKorea, Rep.KosovoKuwaitKyrgyz RepublicLao PDRLate-demographic dividendLatin America & Caribbean Latin America & Caribbean (excluding high income)Latin America & the Caribbean (IDA & IBRD countries)LatviaLeast developed countries: UN classificationLebanonLesothoLiberiaLibyaLiechtensteinLithuaniaLow & middle incomeLow incomeLower middle incomeLuxembourgMacao SAR, ChinaMacedonia, FYRMadagascarMalawiMalaysiaMaldivesMaliMaltaMarshall IslandsMauritaniaMauritiusMexicoMicronesia, Fed. Sts.Middle East & North AfricaMiddle East & North Africa (excluding high income)Middle East & North Africa (IDA & IBRD countries)Middle incomeMoldovaMongoliaMontenegroMoroccoMozambiqueMyanmarNamibiaNepalNetherlandsNew CaledoniaNew ZealandNicaraguaNigerNigeriaNorth AmericaNorwayOECD membersOmanOther small statesPacific island small statesPakistanPalauPanamaPapua New GuineaParaguayPeruPhilippinesPolandPortugalPost-demographic dividendPre-demographic dividendPuerto RicoQatarRomaniaRussian FederationRwandaSamoaSao Tome and PrincipeSaudi ArabiaSenegalSerbiaSeychellesSierra LeoneSingaporeSlovak RepublicSloveniaSmall statesSolomon IslandsSouth AfricaSouth AsiaSouth Asia (IDA & IBRD)SpainSri LankaSt. Kitts and NevisSt. LuciaSt. Vincent and the GrenadinesSub-Saharan Africa Sub-Saharan Africa (excluding high income)Sub-Saharan Africa (IDA & IBRD countries)SudanSurinameSwazilandSwedenSwitzerlandSyrian Arab RepublicTajikistanTanzaniaThailandTimor-LesteTogoTongaTrinidad and TobagoTunisiaTurkeyTurkmenistanTuvaluUgandaUkraineUnited Arab EmiratesUnited KingdomUnited StatesUpper middle incomeUruguayUzbekistanVanuatuVenezuela, RBVietnamWest Bank and GazaWorldYemen, Rep.ZambiaZimbabwe La ligne de temps
Cette échelle de temps montre un graphique de 1961 année à 2016 année Sudan. Les données jusqu'à 1960 année ne sont pas présentés. Quantité d'observations actuelles selon dates: 53.
Source (désignation):
Les indicateurs du développement mondiale
Source (organisation):
World Bank national accounts data, and OECD National Accounts data files.
Catégories:
Economy & Growth
Dernière mise à jour
23 avr. 2017
Les indicateurs de changement de valeurs selon les années
Minimum:
164.333 mln.
1 janv. 1961
Maximum:
17.668 mds
1 janv. 2011
Pour la date d''observation
Valeur
Changement absolu
Le changement par rapport à la valeur précédente
1 janv. 1961
164.333 mln.
+164.333 mln.
0.0%
1 janv. 1962
167.667 mln.
+3.333 mln.
2.03%
1 janv. 1963
179.667 mln.
+12.0 mln.
7.16%
1 janv. 1964
202.0 mln.
+22.333 mln.
12.43%
1 janv. 1965
209.0 mln.
+7.0 mln.
3.47%
1 janv. 1966
201.0 mln.
-8.0 mln.
-3.83%
1 janv. 1967
265.0 mln.
+64.0 mln.
31.84%
1 janv. 1968
274.667 mln.
+9.667 mln.
3.65%
1 janv. 1969
280.0 mln.
+5.333 mln.
1.94%
1 janv. 1970
291.0 mln.
+11.0 mln.
3.93%
1 janv. 1971
306.333 mln.
+15.333 mln.
5.27%
1 janv. 1972
317.333 mln.
+11.0 mln.
3.59%
1 janv. 1973
340.0 mln.
+22.667 mln.
7.14%
1 janv. 1974
432.0 mln.
+92.0 mln.
27.06%
1 janv. 1975
563.667 mln.
+131.667 mln.
30.48%
1 janv. 1976
691.0 mln.
+127.333 mln.
22.59%
1 janv. 1977
834.0 mln.
+143.0 mln.
20.69%
1 janv. 1978
960.667 mln.
+126.667 mln.
15.19%
1 janv. 1979
849.25 mln.
-111.417 mln.
-11.6%
1 janv. 1983
1.251 mds
+401.528 mln.
47.28%
1 janv. 1984
1.165 mds
-85.316 mln.
-6.82%
1 janv. 1985
1.442 mds
+276.61 mln.
23.73%
1 janv. 1986
1.921 mds
+479.062 mln.
33.22%
1 janv. 1987
2.446 mds
+524.367 mln.
27.29%
1 janv. 1988
3.167 mds
+721.333 mln.
29.5%
1 janv. 1989
2.003 mds
-1.164 mds
-36.76%
1 janv. 1990
2.104 mds
+101.444 mln.
5.07%
1 janv. 1991
1.821 mds
-283.182 mln.
-13.46%
1 janv. 1992
1.38 mds
-441.173 mln.
-24.23%
1 janv. 1993
822.531 mln.
-557.321 mln.
-40.39%
1 janv. 1994
1.081 mds
+258.926 mln.
31.48%
1 janv. 1995
1.281 mds
+199.498 mln.
18.45%
1 janv. 1996
1.405 mds
+124.469 mln.
9.72%
1 janv. 1997
1.314 mds
-91.065 mln.
-6.48%
1 janv. 1998
1.639 mds
+324.71 mln.
24.7%
1 janv. 1999
1.639 mds
-488.121 milles
-0.03%
1 janv. 2000
1.659 mds
+20.617 mln.
1.26%
1 janv. 2001
2.461 mds
+802.058 mln.
48.34%
1 janv. 2002
2.374 mds
-87.138 mln.
-3.54%
1 janv. 2003
2.918 mds
+544.256 mln.
22.92%
1 janv. 2004
3.777 mds
+858.279 mln.
29.41%
1 janv. 2005
5.16 mds
+1.383 mds
36.63%
1 janv. 2006
7.129 mds
+1.968 mds
38.15%
1 janv. 2007
9.382 mds
+2.253 mds
31.61%
1 janv. 2008
13.263 mds
+3.881 mds
41.37%
1 janv. 2009
17.307 mds
+4.044 mds
30.49%
1 janv. 2010
12.262 mds
-5.045 mds
-29.15%
1 janv. 2011
17.668 mds
+5.406 mds
44.09%
1 janv. 2012
17.634 mds
-34.28 mln.
-0.19%
1 janv. 2013
2.266 mds
-15.368 mds
-87.15%
1 janv. 2014
1.941 mds
-324.374 mln.
-14.32%
1 janv. 2015
2.075 mds
+133.503 mln.
6.88%
1 janv. 2016
2.014 mds
-60.546 mln.
-2.92%
Classement des pays selon les statistiques actuelles par années


Commentaires: