29
/fr/
fr
AIzaSyAYiBZKx7MnpbEhh9jyipgxe19OcubqV5w
April 1, 2024
251928
St. Vincent and the Grenadines
VCT
true
2
1
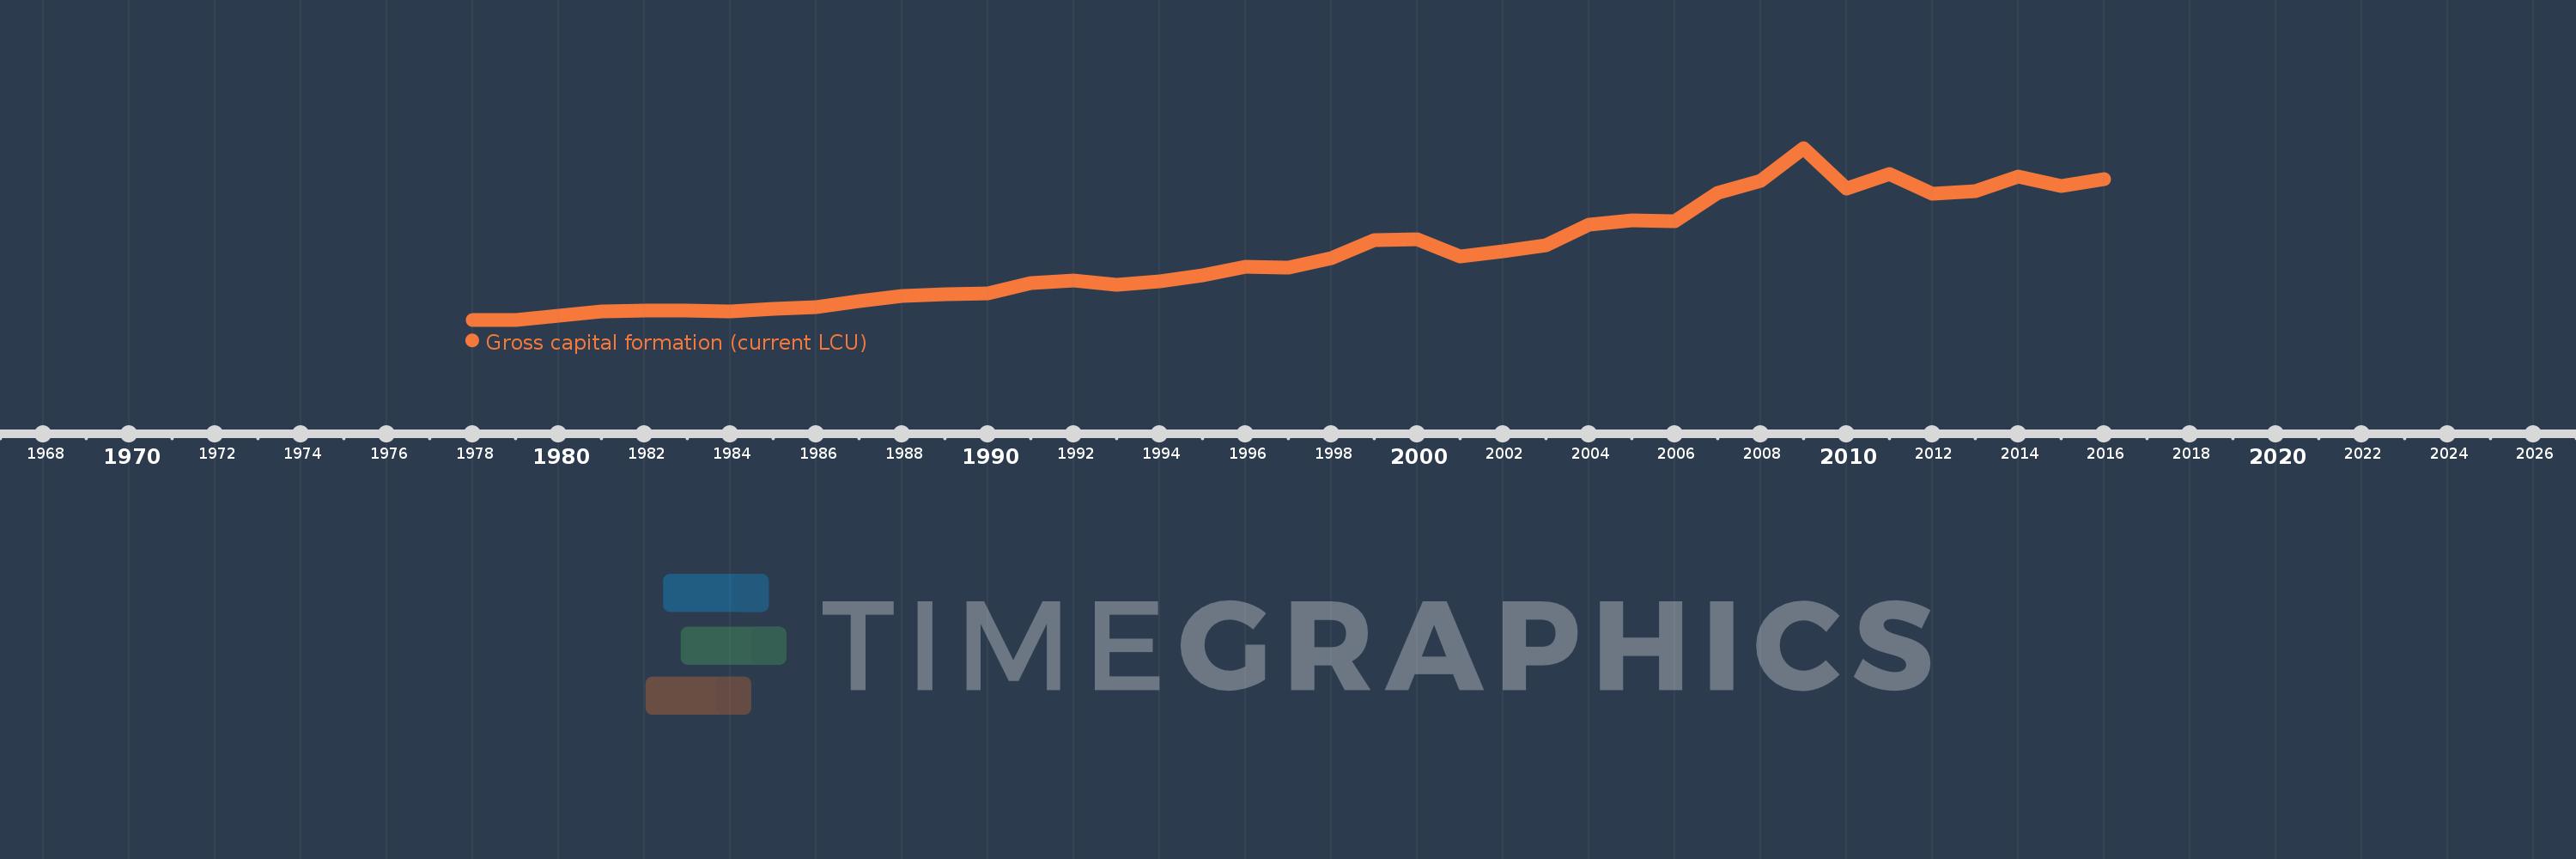
Gross capital formation (current LCU)
2016,2015,2014,2013,2012,2011,2010,2009,2008,2007,2006,2005,2004,2003,2002,2001,2000,1999,1998,1997,1996,1995,1994,1993,1992,1991,1990,1989,1988,1987,1986,1985,1984,1983,1982,1981,1980,1979,1978
Cette statistique dans les autres pays:
AfghanistanAlbaniaAlgeriaAngolaAntigua and BarbudaArgentinaArmeniaArubaAustraliaAustriaAzerbaijanBahamas, TheBahrainBangladeshBarbadosBelarusBelgiumBelizeBeninBermudaBhutanBoliviaBosnia and HerzegovinaBotswanaBrazilBrunei DarussalamBulgariaBurkina FasoBurundiCabo VerdeCambodiaCameroonCanadaCentral African RepublicChadChileChinaColombiaComorosCongo, Dem. Rep.Congo, Rep.Costa RicaCote d'IvoireCroatiaCubaCyprusCzech RepublicDenmarkDjiboutiDominicaDominican RepublicEcuadorEgypt, Arab Rep.El SalvadorEquatorial GuineaEritreaEstoniaEthiopiaFaroe IslandsFijiFinlandFranceGabonGambia, TheGeorgiaGermanyGhanaGreeceGrenadaGuatemalaGuineaGuinea-BissauGuyanaHaitiHondurasHong Kong SAR, ChinaHungaryIcelandIndiaIndonesiaIran, Islamic Rep.IraqIrelandIsraelItalyJamaicaJapanJordanKazakhstanKenyaKiribatiKorea, Rep.KosovoKuwaitKyrgyz RepublicLao PDRLatviaLebanonLesothoLiberiaLibyaLithuaniaLuxembourgMacao SAR, ChinaMacedonia, FYRMadagascarMalawiMalaysiaMaldivesMaliMaltaMauritaniaMauritiusMexicoMicronesia, Fed. Sts.MoldovaMongoliaMontenegroMoroccoMozambiqueNamibiaNepalNetherlandsNew CaledoniaNew ZealandNicaraguaNigerNigeriaNorwayOmanPakistanPanamaPapua New GuineaParaguayPeruPhilippinesPolandPortugalPuerto RicoQatarRomaniaRussian FederationRwandaSaudi ArabiaSenegalSerbiaSeychellesSierra LeoneSingaporeSlovak RepublicSloveniaSolomon IslandsSomaliaSouth AfricaSouth SudanSpainSri LankaSt. Kitts and NevisSt. LuciaSt. Vincent and the GrenadinesSudanSurinameSwazilandSwedenSwitzerlandSyrian Arab RepublicTajikistanTanzaniaThailandTimor-LesteTogoTongaTrinidad and TobagoTunisiaTurkeyTurkmenistanUgandaUkraineUnited Arab EmiratesUnited KingdomUnited StatesUruguayUzbekistanVanuatuVenezuela, RBVietnamWest Bank and GazaYemen, Rep.ZambiaZimbabwe La ligne de temps
Cette échelle de temps montre un graphique de 1978 année à 2016 année St. Vincent and the Grenadines. Les données jusqu'à 1977 année ne sont pas présentés. Quantité d'observations actuelles selon dates: 39.
Source (désignation):
Les indicateurs du développement mondiale
Source (organisation):
World Bank national accounts data, and OECD National Accounts data files.
Catégories:
Economy & Growth
Dernière mise à jour
23 avr. 2017
Les indicateurs de changement de valeurs selon les années
Minimum:
33.88 mln.
1 janv. 1978
Maximum:
622.407 mln.
1 janv. 2009
Pour la date d''observation
Valeur
Changement absolu
Le changement par rapport à la valeur précédente
1 janv. 1978
33.88 mln.
+33.88 mln.
0.0%
1 janv. 1979
34.37 mln.
+490.0 milles
1.45%
1 janv. 1980
48.62 mln.
+14.25 mln.
41.46%
1 janv. 1981
62.84 mln.
+14.22 mln.
29.25%
1 janv. 1982
64.15 mln.
+1.31 mln.
2.08%
1 janv. 1983
64.71 mln.
+560.0 milles
0.87%
1 janv. 1984
62.9 mln.
-1.81 mln.
-2.8%
1 janv. 1985
70.53 mln.
+7.63 mln.
12.13%
1 janv. 1986
76.21 mln.
+5.68 mln.
8.05%
1 janv. 1987
98.9 mln.
+22.69 mln.
29.77%
1 janv. 1988
115.0 mln.
+16.1 mln.
16.28%
1 janv. 1989
121.1 mln.
+6.1 mln.
5.3%
1 janv. 1990
125.5 mln.
+4.4 mln.
3.63%
1 janv. 1991
159.07 mln.
+33.57 mln.
26.75%
1 janv. 1992
168.92 mln.
+9.85 mln.
6.19%
1 janv. 1993
152.77 mln.
-16.15 mln.
-9.56%
1 janv. 1994
165.31 mln.
+12.54 mln.
8.21%
1 janv. 1995
185.4 mln.
+20.09 mln.
12.15%
1 janv. 1996
215.44 mln.
+30.04 mln.
16.2%
1 janv. 1997
212.8 mln.
-2.64 mln.
-1.23%
1 janv. 1998
243.83 mln.
+31.03 mln.
14.58%
1 janv. 1999
306.2 mln.
+62.37 mln.
25.58%
1 janv. 2000
308.38 mln.
+2.18 mln.
0.71%
1 janv. 2001
250.46 mln.
-57.92 mln.
-18.78%
1 janv. 2002
268.86 mln.
+18.4 mln.
7.35%
1 janv. 2003
289.89 mln.
+21.03 mln.
7.82%
1 janv. 2004
359.04 mln.
+69.15 mln.
23.85%
1 janv. 2005
374.59 mln.
+15.55 mln.
4.33%
1 janv. 2006
372.85 mln.
-1.74 mln.
-0.46%
1 janv. 2007
469.56 mln.
+96.71 mln.
25.94%
1 janv. 2008
509.913 mln.
+40.353 mln.
8.59%
1 janv. 2009
622.407 mln.
+112.494 mln.
22.06%
1 janv. 2010
482.928 mln.
-139.479 mln.
-22.41%
1 janv. 2011
533.179 mln.
+50.251 mln.
10.41%
1 janv. 2012
464.315 mln.
-68.863 mln.
-12.92%
1 janv. 2013
475.727 mln.
+11.412 mln.
2.46%
1 janv. 2014
523.795 mln.
+48.068 mln.
10.1%
1 janv. 2015
491.178 mln.
-32.617 mln.
-6.23%
1 janv. 2016
516.59 mln.
+25.412 mln.
5.17%
Classement des pays selon les statistiques actuelles par années


Commentaires: