29
/fr/
fr
AIzaSyAYiBZKx7MnpbEhh9jyipgxe19OcubqV5w
April 1, 2024
250910
St. Lucia
LCA
true
2
1
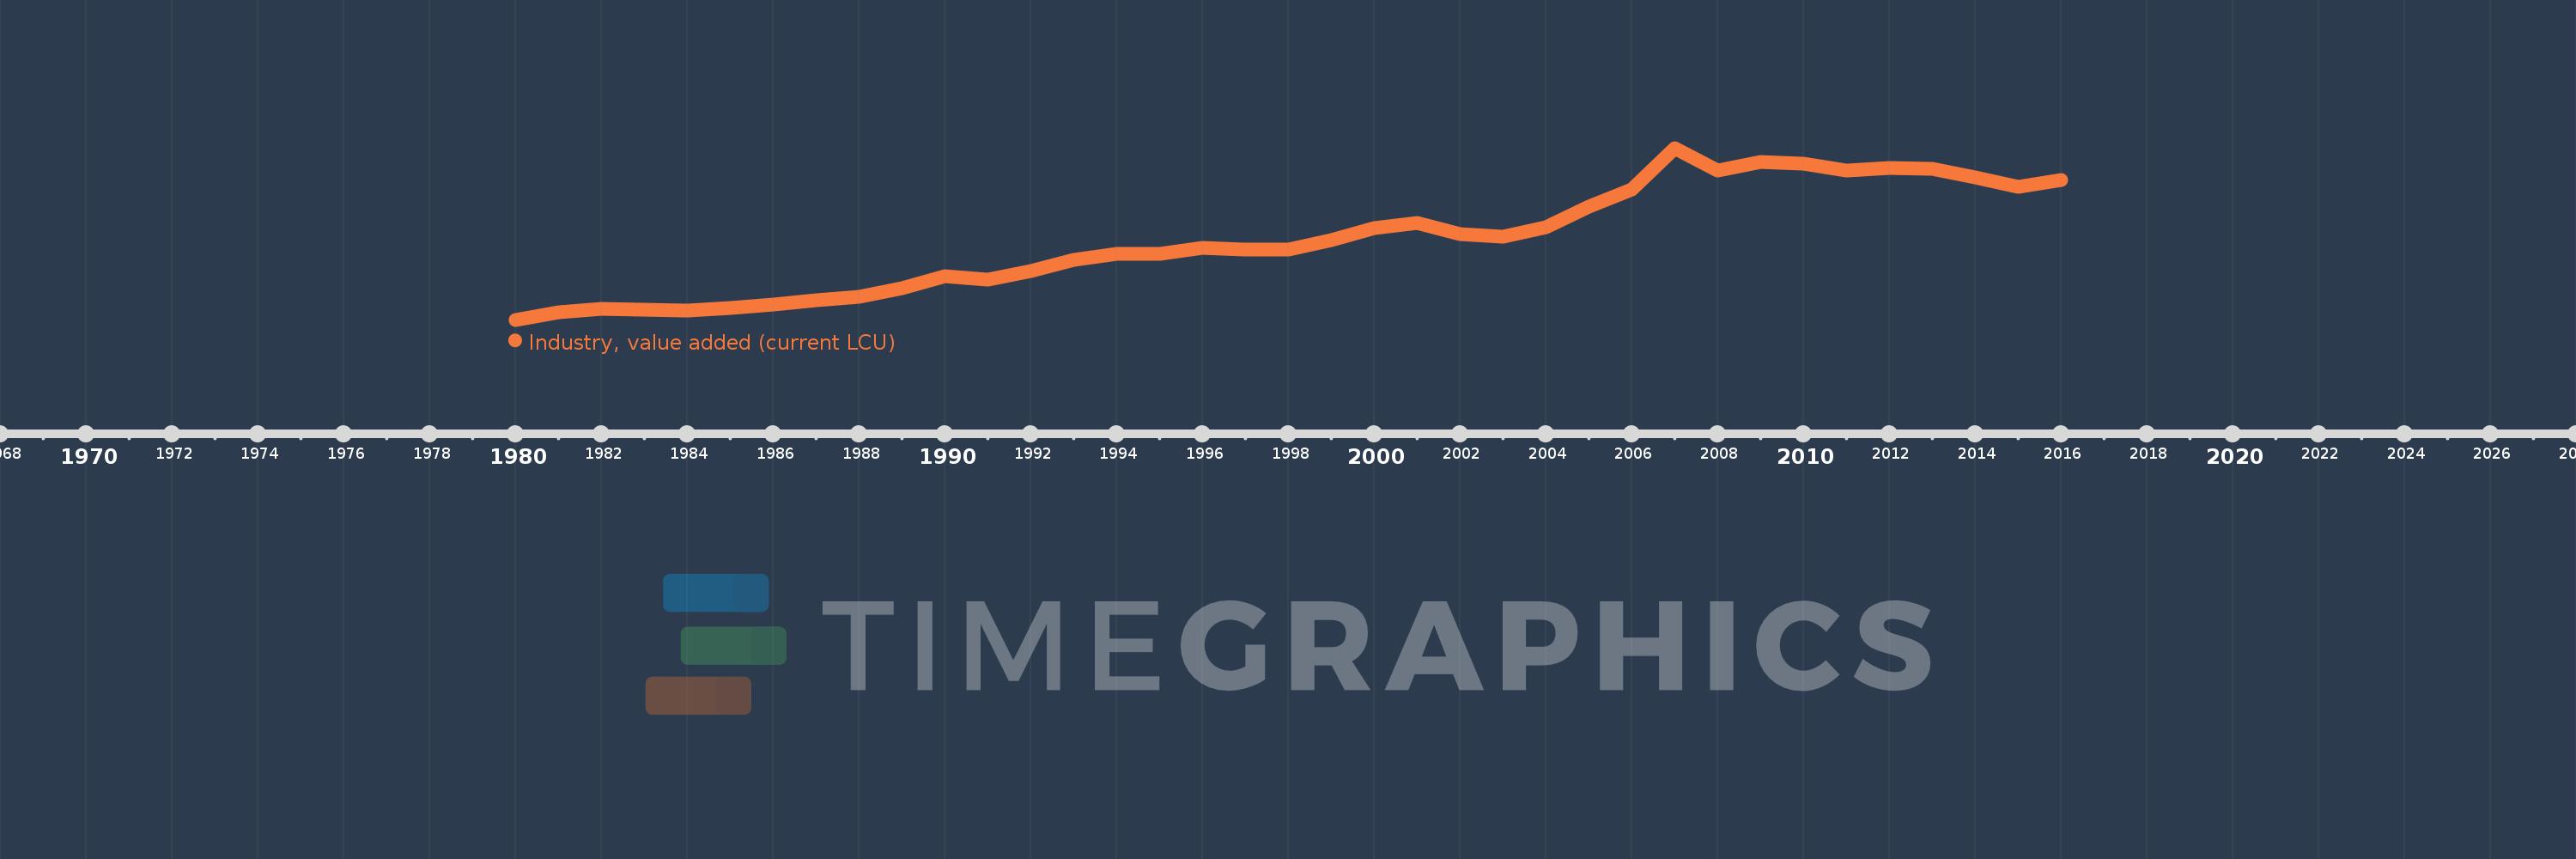
Industry, value added (current LCU)
2016,2015,2014,2013,2012,2011,2010,2009,2008,2007,2006,2005,2004,2003,2002,2001,2000,1999,1998,1997,1996,1995,1994,1993,1992,1991,1990,1989,1988,1987,1986,1985,1984,1983,1982,1981,1980
Cette statistique dans les autres pays:
AfghanistanAlbaniaAlgeriaAndorraAngolaAntigua and BarbudaArgentinaArmeniaArubaAustraliaAustriaAzerbaijanBahamas, TheBahrainBangladeshBarbadosBelarusBelgiumBelizeBeninBermudaBhutanBoliviaBosnia and HerzegovinaBotswanaBrazilBrunei DarussalamBulgariaBurkina FasoBurundiCabo VerdeCambodiaCameroonCanadaCayman IslandsCentral African RepublicChadChileChinaColombiaComorosCongo, Dem. Rep.Congo, Rep.Costa RicaCote d'IvoireCroatiaCubaCyprusCzech RepublicDenmarkDjiboutiDominicaDominican RepublicEcuadorEgypt, Arab Rep.El SalvadorEquatorial GuineaEritreaEstoniaEthiopiaFijiFinlandFranceGabonGambia, TheGeorgiaGermanyGhanaGreeceGrenadaGuatemalaGuineaGuinea-BissauGuyanaHondurasHong Kong SAR, ChinaHungaryIcelandIndiaIndonesiaIran, Islamic Rep.IraqIrelandItalyJamaicaJapanJordanKazakhstanKenyaKiribatiKorea, Rep.KosovoKuwaitKyrgyz RepublicLao PDRLatviaLebanonLesothoLiberiaLibyaLiechtensteinLithuaniaLuxembourgMacao SAR, ChinaMacedonia, FYRMadagascarMalawiMalaysiaMaldivesMaliMaltaMarshall IslandsMauritaniaMauritiusMexicoMicronesia, Fed. Sts.MoldovaMongoliaMontenegroMoroccoMozambiqueMyanmarNamibiaNepalNetherlandsNew CaledoniaNew ZealandNicaraguaNigerNigeriaNorwayOmanPakistanPalauPanamaPapua New GuineaParaguayPeruPhilippinesPolandPortugalPuerto RicoQatarRomaniaRussian FederationRwandaSamoaSao Tome and PrincipeSaudi ArabiaSenegalSerbiaSeychellesSierra LeoneSingaporeSlovak RepublicSloveniaSolomon IslandsSomaliaSouth AfricaSpainSri LankaSt. Kitts and NevisSt. LuciaSt. Vincent and the GrenadinesSudanSurinameSwazilandSwedenSwitzerlandSyrian Arab RepublicTajikistanTanzaniaThailandTimor-LesteTogoTongaTrinidad and TobagoTunisiaTurkeyTurkmenistanTuvaluUgandaUkraineUnited Arab EmiratesUnited KingdomUnited StatesUruguayUzbekistanVanuatuVenezuela, RBVietnamWest Bank and GazaYemen, Rep.ZambiaZimbabwe La ligne de temps
Cette échelle de temps montre un graphique de 1980 année à 2016 année St. Lucia. Les données jusqu'à 1979 année ne sont pas présentés. Quantité d'observations actuelles selon dates: 37.
Source (désignation):
Les indicateurs du développement mondiale
Source (organisation):
World Bank national accounts data, and OECD National Accounts data files.
Catégories:
Economy & Growth
Dernière mise à jour
23 avr. 2017
Les indicateurs de changement de valeurs selon les années
Minimum:
52.2 mln.
1 janv. 1980
Maximum:
523.78 mln.
1 janv. 2007
Pour la date d''observation
Valeur
Changement absolu
Le changement par rapport à la valeur précédente
1 janv. 1980
52.2 mln.
+52.2 mln.
0.0%
1 janv. 1981
73.4 mln.
+21.2 mln.
40.61%
1 janv. 1982
82.06 mln.
+8.66 mln.
11.8%
1 janv. 1983
80.61 mln.
-1.45 mln.
-1.77%
1 janv. 1984
76.51 mln.
-4.1 mln.
-5.09%
1 janv. 1985
83.6 mln.
+7.09 mln.
9.27%
1 janv. 1986
92.86 mln.
+9.26 mln.
11.08%
1 janv. 1987
104.85 mln.
+11.99 mln.
12.91%
1 janv. 1988
114.88 mln.
+10.03 mln.
9.57%
1 janv. 1989
139.24 mln.
+24.36 mln.
21.2%
1 janv. 1990
172.42 mln.
+33.18 mln.
23.83%
1 janv. 1991
162.94 mln.
-9.48 mln.
-5.5%
1 janv. 1992
185.22 mln.
+22.28 mln.
13.67%
1 janv. 1993
216.26 mln.
+31.04 mln.
16.76%
1 janv. 1994
233.38 mln.
+17.12 mln.
7.92%
1 janv. 1995
232.63 mln.
-750.0 milles
-0.32%
1 janv. 1996
250.08 mln.
+17.45 mln.
7.5%
1 janv. 1997
243.7 mln.
-6.38 mln.
-2.55%
1 janv. 1998
245.8 mln.
+2.1 mln.
0.86%
1 janv. 1999
269.96 mln.
+24.16 mln.
9.83%
1 janv. 2000
303.1 mln.
+33.14 mln.
12.28%
1 janv. 2001
319.027 mln.
+15.927 mln.
5.25%
1 janv. 2002
287.269 mln.
-31.757 mln.
-9.95%
1 janv. 2003
279.219 mln.
-8.05 mln.
-2.8%
1 janv. 2004
304.989 mln.
+25.77 mln.
9.23%
1 janv. 2005
361.686 mln.
+56.697 mln.
18.59%
1 janv. 2006
409.795 mln.
+48.109 mln.
13.3%
1 janv. 2007
523.78 mln.
+113.985 mln.
27.82%
1 janv. 2008
461.383 mln.
-62.397 mln.
-11.91%
1 janv. 2009
486.212 mln.
+24.829 mln.
5.38%
1 janv. 2010
480.772 mln.
-5.44 mln.
-1.12%
1 janv. 2011
460.614 mln.
-20.157 mln.
-4.19%
1 janv. 2012
469.594 mln.
+8.979 mln.
1.95%
1 janv. 2013
467.361 mln.
-2.233 mln.
-0.48%
1 janv. 2014
444.051 mln.
-23.31 mln.
-4.99%
1 janv. 2015
415.888 mln.
-28.163 mln.
-6.34%
1 janv. 2016
436.296 mln.
+20.408 mln.
4.91%
Classement des pays selon les statistiques actuelles par années


Commentaires: