29
/fr/
fr
AIzaSyAYiBZKx7MnpbEhh9jyipgxe19OcubqV5w
April 1, 2024
248232
Spain
ESP
true
2
1
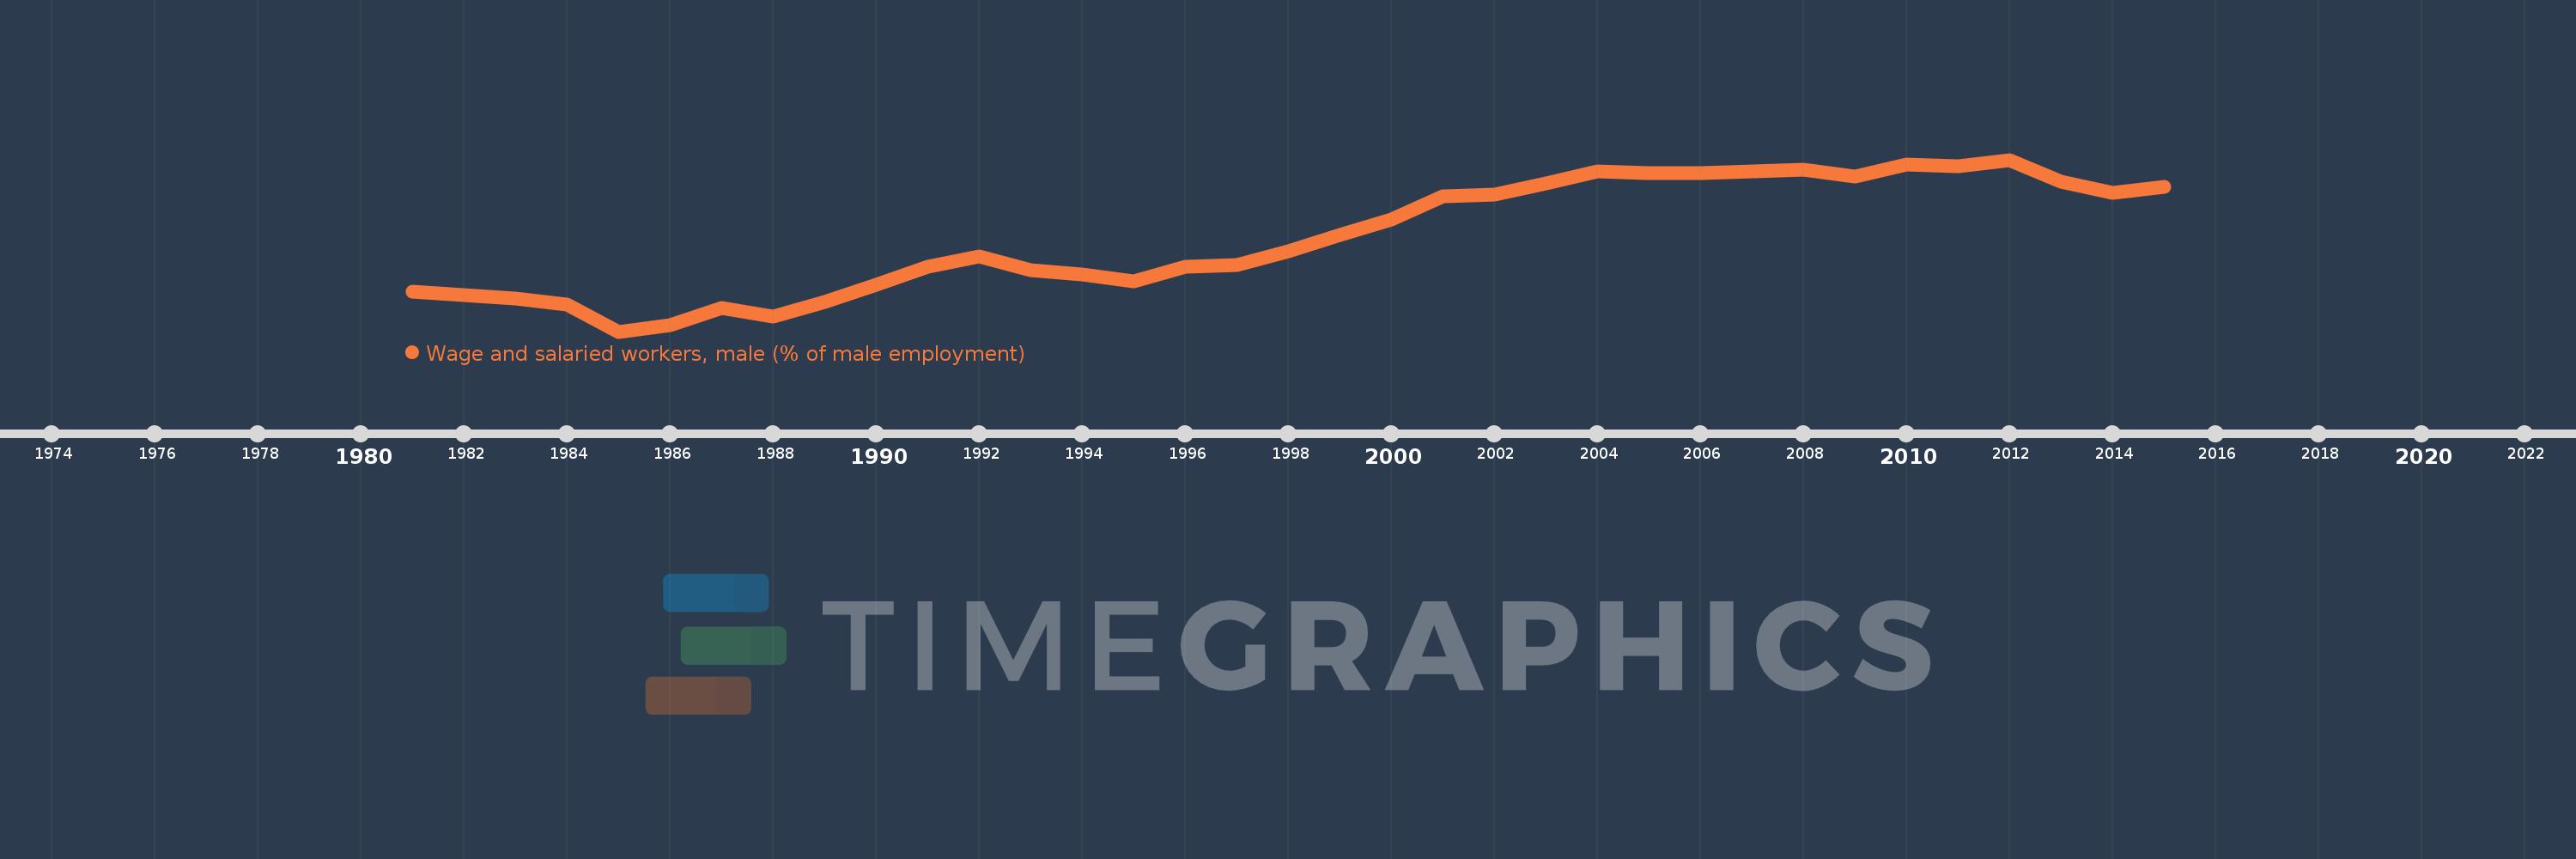
Wage and salaried workers, male (% of male employment)
2015,2014,2013,2012,2011,2010,2009,2008,2007,2006,2005,2004,2003,2002,2001,2000,1999,1998,1997,1996,1995,1994,1993,1992,1991,1990,1989,1988,1987,1986,1985,1984,1983,1982,1981
Cette statistique dans les autres pays:
AlbaniaAlgeriaAmerican SamoaAntigua and BarbudaArgentinaArmeniaArubaAustraliaAustriaAzerbaijanBahamas, TheBahrainBangladeshBarbadosBelarusBelgiumBelizeBeninBermudaBhutanBoliviaBosnia and HerzegovinaBotswanaBrazilBritish Virgin IslandsBrunei DarussalamBulgariaBurkina FasoBurundiCabo VerdeCambodiaCameroonCanadaCaribbean small statesCayman IslandsCentral Europe and the BalticsChadChileColombiaCongo, Rep.Costa RicaCote d'IvoireCroatiaCubaCyprusCzech RepublicDenmarkDjiboutiDominicaDominican RepublicEarly-demographic dividendEcuadorEgypt, Arab Rep.El SalvadorEquatorial GuineaEstoniaEthiopiaEuro areaEurope & Central AsiaEurope & Central Asia (excluding high income)Europe & Central Asia (IDA & IBRD countries)European UnionFijiFinlandFranceFrench PolynesiaGabonGambia, TheGeorgiaGermanyGhanaGreeceGrenadaGuatemalaGuineaGuyanaHaitiHigh incomeHondurasHong Kong SAR, ChinaHungaryIcelandIndiaIndonesiaIran, Islamic Rep.IrelandIsle of ManIsraelItalyJamaicaJapanJordanKazakhstanKenyaKiribatiKorea, Rep.KosovoKuwaitKyrgyz RepublicLao PDRLatin America & Caribbean Latin America & Caribbean (excluding high income)Latin America & the Caribbean (IDA & IBRD countries)LatviaLebanonLesothoLiberiaLithuaniaLower middle incomeLuxembourgMacao SAR, ChinaMacedonia, FYRMadagascarMalawiMalaysiaMaldivesMaliMaltaMarshall IslandsMauritiusMexicoMiddle East & North AfricaMiddle East & North Africa (excluding high income)Middle East & North Africa (IDA & IBRD countries)MoldovaMongoliaMontenegroMoroccoMozambiqueNamibiaNepalNetherlandsNew CaledoniaNew ZealandNicaraguaNigerNorth AmericaNorwayOECD membersOmanPakistanPanamaParaguayPeruPhilippinesPolandPortugalPost-demographic dividendPuerto RicoQatarRomaniaRussian FederationRwandaSamoaSan MarinoSao Tome and PrincipeSaudi ArabiaSenegalSerbiaSeychellesSierra LeoneSingaporeSlovak RepublicSloveniaSouth AfricaSouth AsiaSouth Asia (IDA & IBRD)SpainSri LankaSt. Kitts and NevisSt. LuciaSt. Vincent and the GrenadinesSurinameSwazilandSwedenSwitzerlandSyrian Arab RepublicTajikistanTanzaniaThailandTimor-LesteTogoTongaTrinidad and TobagoTunisiaTurkeyTurks and Caicos IslandsTuvaluUgandaUkraineUnited Arab EmiratesUnited KingdomUnited StatesUruguayVanuatuVenezuela, RBVietnamWest Bank and GazaYemen, Rep.ZambiaZimbabwe La ligne de temps
Cette échelle de temps montre un graphique de 1981 année à 2015 année Spain. Les données jusqu'à 1980 année ne sont pas présentés. Quantité d'observations actuelles selon dates: 35.
Source (désignation):
Les indicateurs du développement mondiale
Source (organisation):
International Labour Organization, Key Indicators of the Labour Market database.
Catégories:
Social Protection & Labor, Gender
Dernière mise à jour
23 avr. 2017
Les indicateurs de changement de valeurs selon les années
Pour la date d''observation
Valeur
Changement absolu
Le changement par rapport à la valeur précédente
1 janv. 1981
72.2
+72.2
0.0%
1 janv. 1982
72.0
-0.2
-0.28%
1 janv. 1983
71.8
-0.2
-0.28%
1 janv. 1984
71.4
-0.4
-0.56%
1 janv. 1985
69.8
-1.6
-2.24%
1 janv. 1986
70.2
+0.4
0.57%
1 janv. 1987
71.2
+1.0
1.42%
1 janv. 1988
70.7
-0.5
-0.7%
1 janv. 1989
71.6
+0.9
1.27%
1 janv. 1990
72.6
+1.0
1.4%
1 janv. 1991
73.7
+1.1
1.52%
1 janv. 1992
74.3
+0.6
0.81%
1 janv. 1993
73.5
-0.8
-1.08%
1 janv. 1994
73.2
-0.3
-0.41%
1 janv. 1995
72.8
-0.4
-0.55%
1 janv. 1996
73.7
+0.9
1.24%
1 janv. 1997
73.8
+0.1
0.14%
1 janv. 1998
74.6
+0.8
1.08%
1 janv. 1999
75.6
+1.0
1.34%
1 janv. 2000
76.5
+0.9
1.19%
1 janv. 2001
77.9
+1.4
1.83%
1 janv. 2002
78.0
+0.1
0.13%
1 janv. 2003
78.7
+0.7
0.9%
1 janv. 2004
79.4
+0.7
0.89%
1 janv. 2005
79.3
-0.1
-0.13%
1 janv. 2006
79.3
0.0
0.0%
1 janv. 2007
79.4
+0.1
0.13%
1 janv. 2008
79.5
+0.1
0.13%
1 janv. 2009
79.1
-0.4
-0.5%
1 janv. 2010
79.8
+0.7
0.88%
1 janv. 2011
79.7
-0.1
-0.13%
1 janv. 2012
80.1
+0.4
0.5%
1 janv. 2013
78.8
-1.3
-1.62%
1 janv. 2014
78.1
-0.7
-0.89%
1 janv. 2015
78.5
+0.4
0.51%
Classement des pays selon les statistiques actuelles par années


Commentaires: