29
/fr/
fr
AIzaSyAYiBZKx7MnpbEhh9jyipgxe19OcubqV5w
April 1, 2024
248169
Spain
ESP
true
2
1
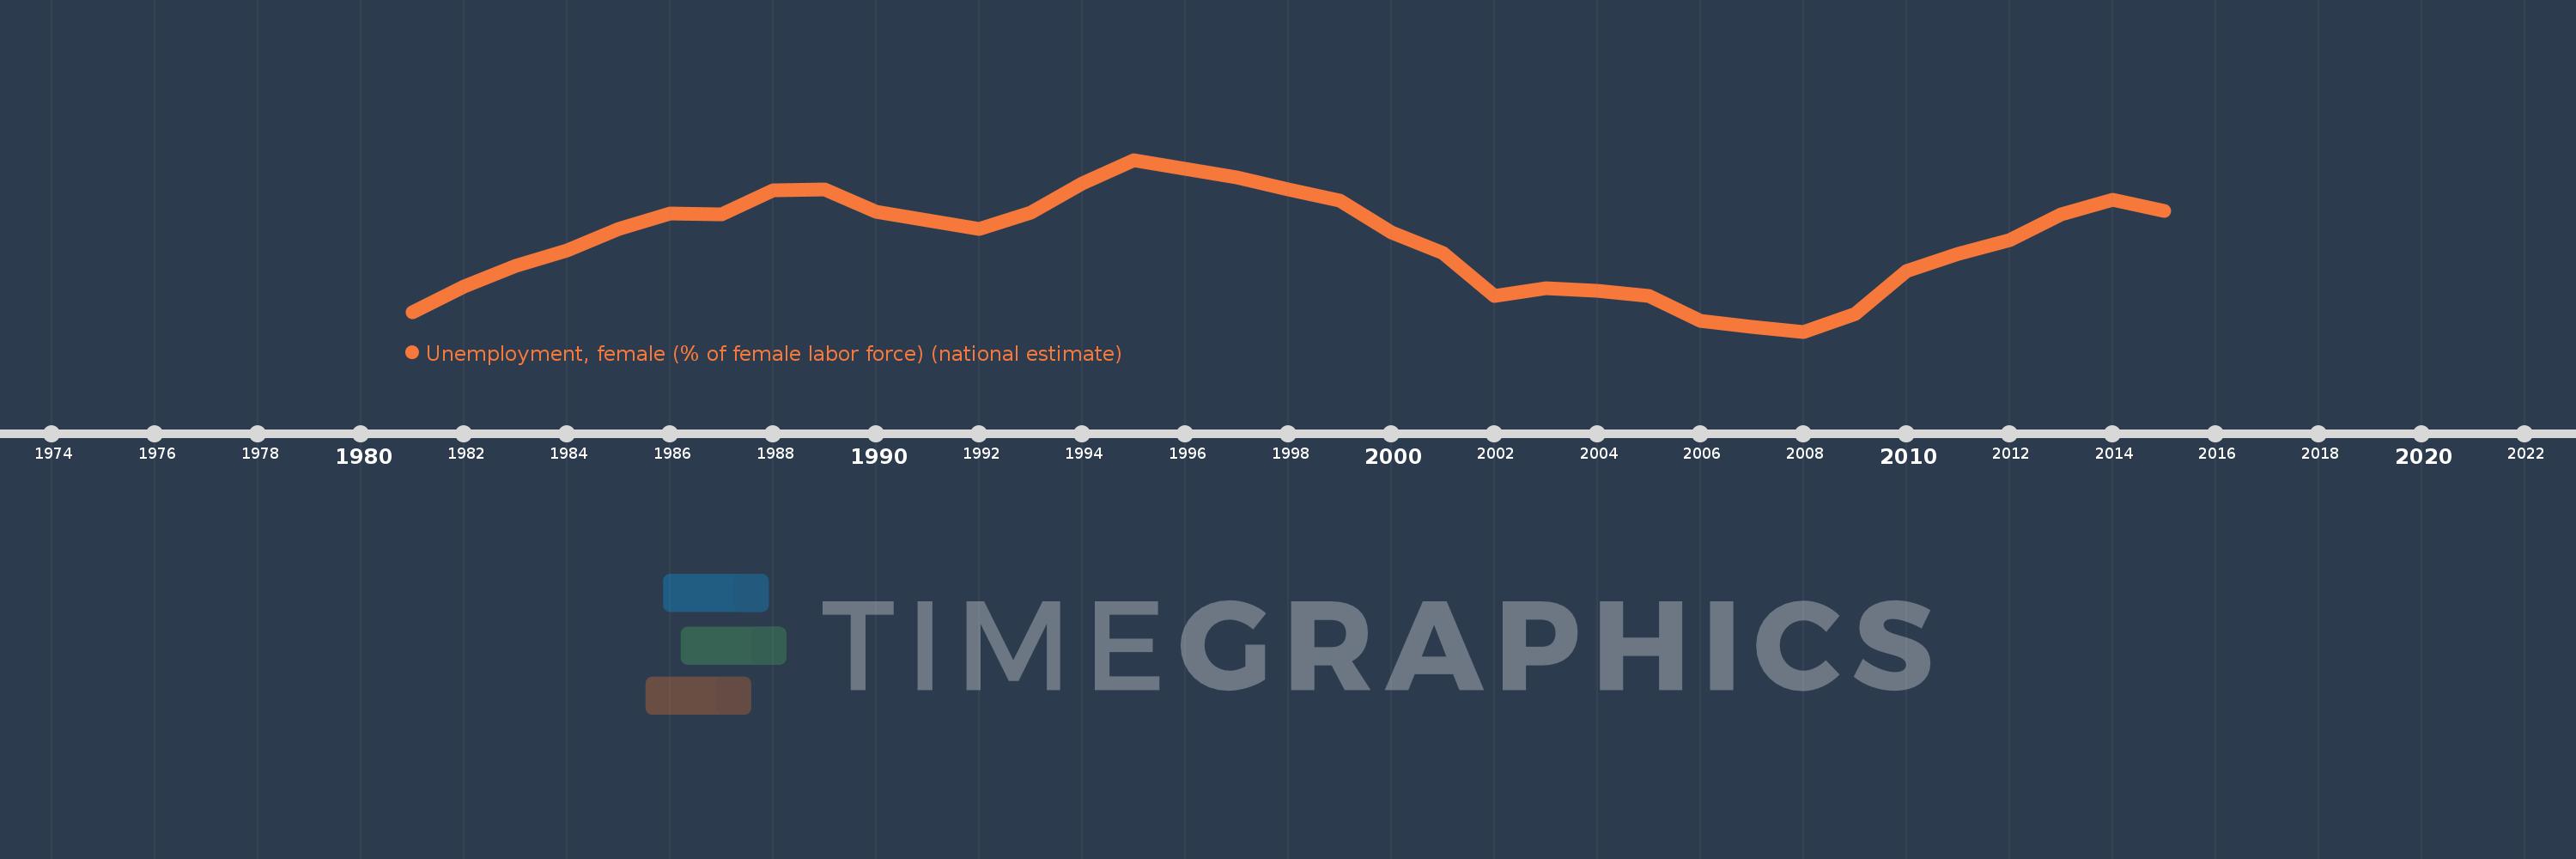
Unemployment, female (% of female labor force) (national estimate)
2015,2014,2013,2012,2011,2010,2009,2008,2007,2006,2005,2004,2003,2002,2001,2000,1999,1998,1997,1996,1995,1994,1993,1992,1991,1990,1989,1988,1987,1986,1985,1984,1983,1982,1981
Cette statistique dans les autres pays:
AfghanistanAlbaniaAlgeriaAmerican SamoaAntigua and BarbudaArab WorldArgentinaArmeniaArubaAustraliaAustriaAzerbaijanBahamas, TheBahrainBangladeshBarbadosBelarusBelgiumBelizeBeninBermudaBhutanBoliviaBosnia and HerzegovinaBotswanaBrazilBritish Virgin IslandsBrunei DarussalamBulgariaBurkina FasoBurundiCabo VerdeCambodiaCameroonCanadaCaribbean small statesCayman IslandsCentral Europe and the BalticsChadChileChinaColombiaComorosCongo, Dem. Rep.Costa RicaCote d'IvoireCroatiaCubaCyprusCzech RepublicDenmarkDjiboutiDominicaDominican RepublicEarly-demographic dividendEast Asia & PacificEast Asia & Pacific (excluding high income)East Asia & Pacific (IDA & IBRD countries)EcuadorEgypt, Arab Rep.El SalvadorEquatorial GuineaEstoniaEthiopiaEuro areaEurope & Central AsiaEurope & Central Asia (excluding high income)Europe & Central Asia (IDA & IBRD countries)European UnionFaroe IslandsFijiFinlandFranceFrench PolynesiaGabonGambia, TheGeorgiaGermanyGhanaGibraltarGreeceGreenlandGrenadaGuamGuatemalaGuineaGuyanaHaitiHigh incomeHondurasHong Kong SAR, ChinaHungaryIBRD onlyIcelandIDA & IBRD totalIDA blendIndiaIndonesiaIran, Islamic Rep.IraqIrelandIsle of ManIsraelItalyJamaicaJapanJordanKazakhstanKiribatiKorea, Rep.KosovoKuwaitKyrgyz RepublicLao PDRLate-demographic dividendLatin America & Caribbean Latin America & Caribbean (excluding high income)Latin America & the Caribbean (IDA & IBRD countries)LatviaLebanonLesothoLiberiaLibyaLiechtensteinLithuaniaLow & middle incomeLower middle incomeLuxembourgMacao SAR, ChinaMacedonia, FYRMadagascarMalawiMalaysiaMaldivesMaliMaltaMarshall IslandsMauritaniaMauritiusMexicoMiddle East & North AfricaMiddle East & North Africa (excluding high income)Middle East & North Africa (IDA & IBRD countries)Middle incomeMoldovaMonacoMongoliaMontenegroMoroccoMozambiqueMyanmarNamibiaNauruNepalNetherlandsNew CaledoniaNew ZealandNicaraguaNigerNigeriaNorth AmericaNorthern Mariana IslandsNorwayOECD membersPakistanPalauPanamaPapua New GuineaParaguayPeruPhilippinesPolandPortugalPost-demographic dividendPuerto RicoQatarRomaniaRussian FederationRwandaSamoaSan MarinoSao Tome and PrincipeSaudi ArabiaSenegalSerbiaSeychellesSierra LeoneSingaporeSlovak RepublicSloveniaSolomon IslandsSouth AfricaSouth AsiaSouth Asia (IDA & IBRD)South SudanSpainSri LankaSt. Kitts and NevisSt. LuciaSt. Vincent and the GrenadinesSudanSurinameSwazilandSwedenSwitzerlandSyrian Arab RepublicTajikistanTanzaniaThailandTimor-LesteTongaTrinidad and TobagoTunisiaTurkeyTuvaluUgandaUkraineUnited Arab EmiratesUnited KingdomUnited StatesUpper middle incomeUruguayVanuatuVenezuela, RBVietnamWest Bank and GazaWorldYemen, Rep.ZambiaZimbabwe La ligne de temps
Cette échelle de temps montre un graphique de 1981 année à 2015 année Spain. Les données jusqu'à 1980 année ne sont pas présentés. Quantité d'observations actuelles selon dates: 35.
Source (désignation):
Les indicateurs du développement mondiale
Source (organisation):
International Labour Organization, Key Indicators of the Labour Market database.
Catégories:
Social Protection & Labor
Dernière mise à jour
23 avr. 2017
Les indicateurs de changement de valeurs selon les années
Pour la date d''observation
Valeur
Changement absolu
Le changement par rapport à la valeur précédente
1 janv. 1981
13.1
+13.1
0.0%
1 janv. 1982
16.2
+3.1
23.66%
1 janv. 1983
18.7
+2.5
15.43%
1 janv. 1984
20.6
+1.9
10.16%
1 janv. 1985
23.2
+2.6
12.62%
1 janv. 1986
25.1
+1.9
8.19%
1 janv. 1987
25.0
-0.1
-0.4%
1 janv. 1988
27.9
+2.9
11.6%
1 janv. 1989
28.0
+0.1
0.36%
1 janv. 1990
25.3
-2.7
-9.64%
1 janv. 1991
24.2
-1.1
-4.35%
1 janv. 1992
23.2
-1.0
-4.13%
1 janv. 1993
25.2
+2.0
8.62%
1 janv. 1994
28.7
+3.5
13.89%
1 janv. 1995
31.6
+2.9
10.1%
1 janv. 1996
30.5
-1.1
-3.48%
1 janv. 1997
29.5
-1.0
-3.28%
1 janv. 1998
28.0
-1.5
-5.08%
1 janv. 1999
26.6
-1.4
-5.0%
1 janv. 2000
22.8
-3.8
-14.29%
1 janv. 2001
20.3
-2.5
-10.96%
1 janv. 2002
15.0
-5.3
-26.11%
1 janv. 2003
16.0
+1.0
6.67%
1 janv. 2004
15.7
-0.3
-1.88%
1 janv. 2005
15.0
-0.7
-4.46%
1 janv. 2006
12.0
-3.0
-20.0%
1 janv. 2007
11.3
-0.7
-5.83%
1 janv. 2008
10.7
-0.6
-5.31%
1 janv. 2009
12.8
+2.1
19.63%
1 janv. 2010
18.1
+5.3
41.41%
1 janv. 2011
20.2
+2.1
11.6%
1 janv. 2012
21.8
+1.6
7.92%
1 janv. 2013
25.0
+3.2
14.68%
1 janv. 2014
26.7
+1.7
6.8%
1 janv. 2015
25.4
-1.3
-4.87%
Classement des pays selon les statistiques actuelles par années


Commentaires: