29
/fr/
fr
AIzaSyAYiBZKx7MnpbEhh9jyipgxe19OcubqV5w
April 1, 2024
245467
South Africa
ZAF
true
2
1
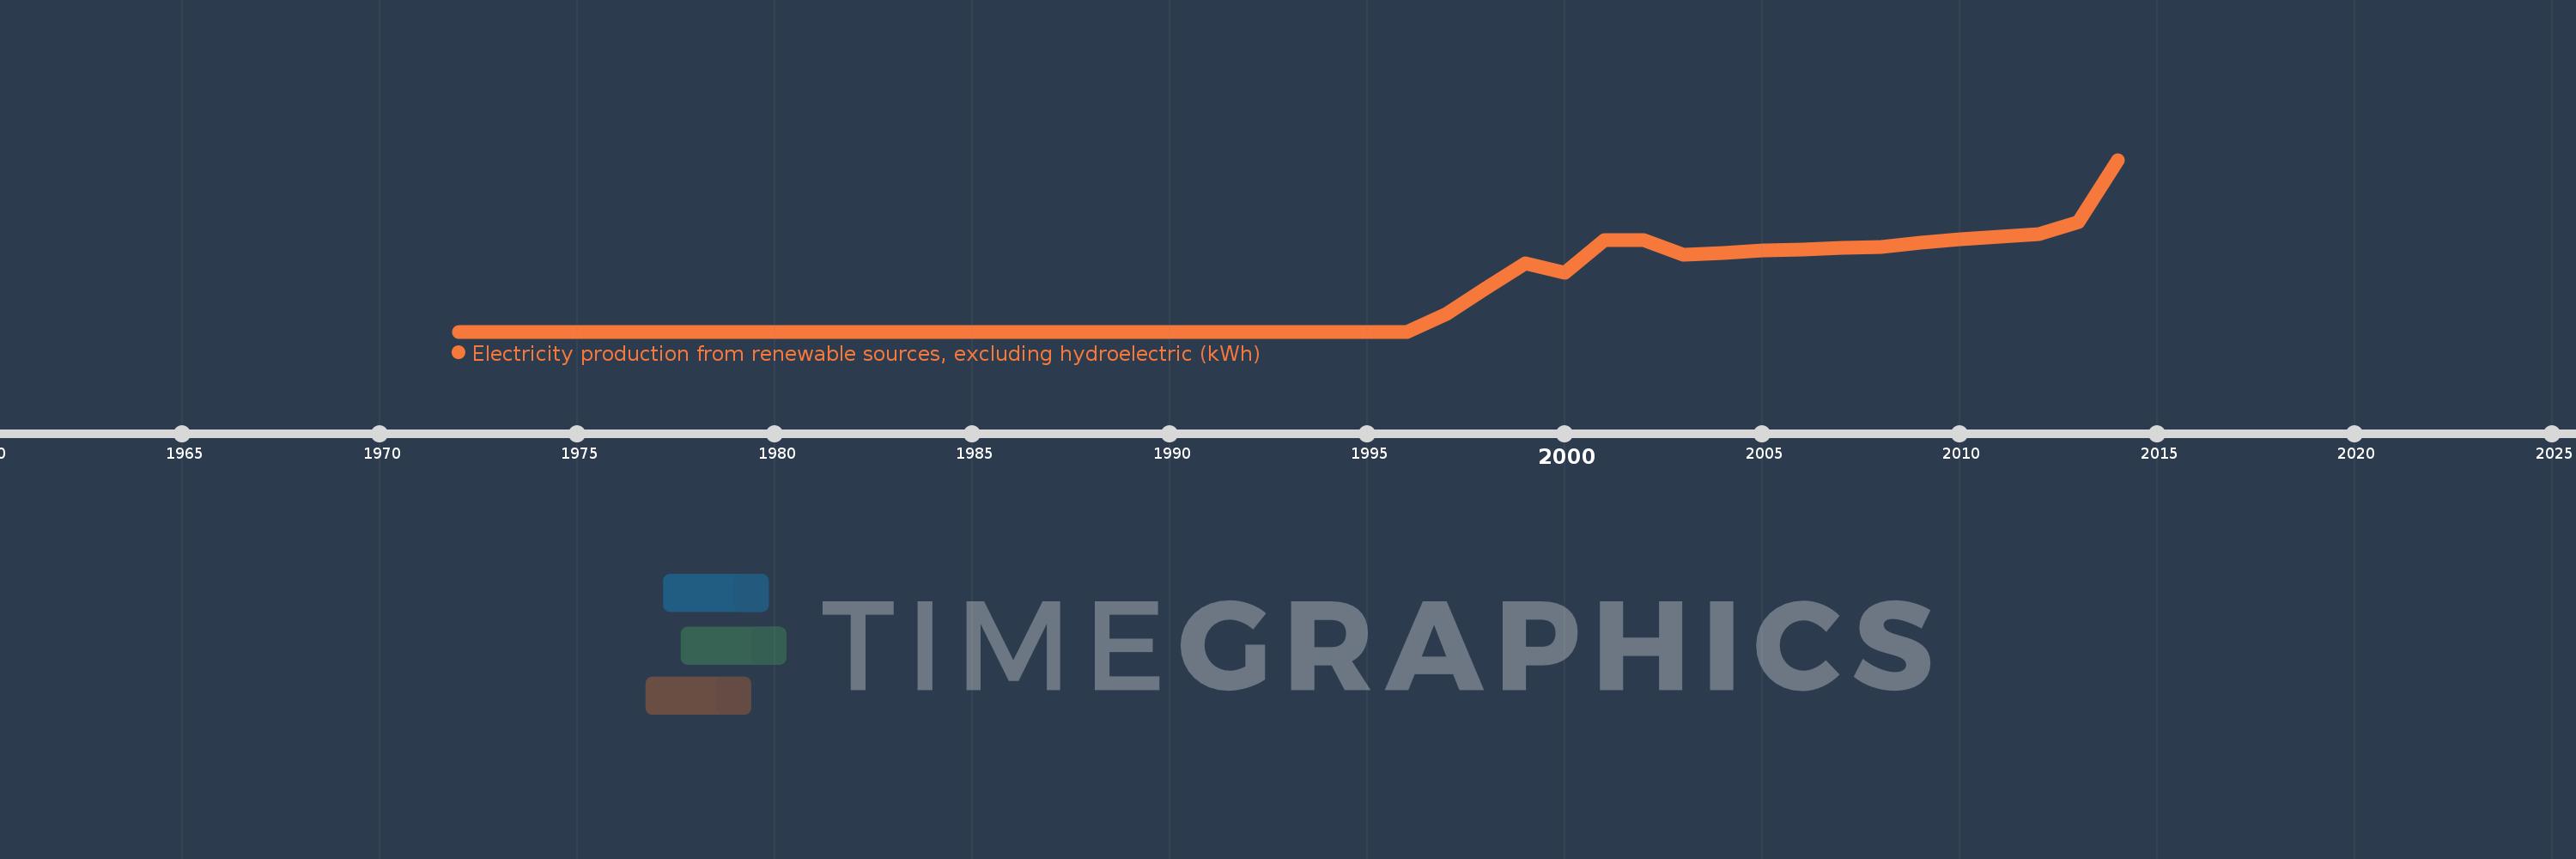
Electricity production from renewable sources, excluding hydroelectric (kWh)
2014,2013,2012,2011,2010,2009,2008,2007,2006,2005,2004,2003,2002,2001,2000,1999,1998,1997,1996,1995,1994,1993,1992,1991,1990,1989,1988,1987,1986,1985,1984,1983,1982,1981,1980,1979,1978,1977,1976,1975,1974,1973,1972
Cette statistique dans les autres pays:
AlbaniaAlgeriaAngolaArab WorldArgentinaArmeniaAustraliaAustriaAzerbaijanBahrainBangladeshBelarusBelgiumBeninBoliviaBosnia and HerzegovinaBotswanaBrazilBrunei DarussalamBulgariaCambodiaCameroonCanadaCaribbean small statesCentral Europe and the BalticsChileChinaColombiaCongo, Dem. Rep.Congo, Rep.Costa RicaCote d'IvoireCroatiaCubaCuracaoCyprusCzech RepublicDenmarkDominican RepublicEarly-demographic dividendEast Asia & PacificEast Asia & Pacific (excluding high income)East Asia & Pacific (IDA & IBRD countries)EcuadorEgypt, Arab Rep.El SalvadorEritreaEstoniaEthiopiaEuro areaEurope & Central AsiaEurope & Central Asia (excluding high income)Europe & Central Asia (IDA & IBRD countries)European UnionFinlandFragile and conflict affected situationsFranceGabonGeorgiaGermanyGhanaGibraltarGreeceGuatemalaHaitiHeavily indebted poor countries (HIPC)High incomeHondurasHong Kong SAR, ChinaHungaryIBRD onlyIcelandIDA & IBRD totalIDA blendIDA onlyIDA totalIndiaIndonesiaIran, Islamic Rep.IraqIrelandIsraelItalyJamaicaJapanJordanKazakhstanKenyaKorea, Dem. People’s Rep.Korea, Rep.KosovoKuwaitKyrgyz RepublicLate-demographic dividendLatin America & Caribbean Latin America & Caribbean (excluding high income)Latin America & the Caribbean (IDA & IBRD countries)LatviaLeast developed countries: UN classificationLebanonLibyaLithuaniaLow & middle incomeLow incomeLower middle incomeLuxembourgMacedonia, FYRMalaysiaMaltaMauritiusMexicoMiddle East & North AfricaMiddle East & North Africa (excluding high income)Middle East & North Africa (IDA & IBRD countries)Middle incomeMoldovaMongoliaMontenegroMoroccoMozambiqueMyanmarNamibiaNepalNetherlandsNew ZealandNicaraguaNigerNigeriaNorth AmericaNorwayOECD membersOmanOther small statesPakistanPanamaParaguayPeruPhilippinesPolandPortugalPost-demographic dividendPre-demographic dividendQatarRomaniaRussian FederationSaudi ArabiaSenegalSerbiaSingaporeSlovak RepublicSloveniaSmall statesSouth AfricaSouth AsiaSouth Asia (IDA & IBRD)South SudanSpainSri LankaSub-Saharan Africa Sub-Saharan Africa (excluding high income)Sub-Saharan Africa (IDA & IBRD countries)SudanSwedenSwitzerlandSyrian Arab RepublicTajikistanTanzaniaThailandTogoTrinidad and TobagoTunisiaTurkeyTurkmenistanUkraineUnited Arab EmiratesUnited KingdomUnited StatesUpper middle incomeUruguayUzbekistanVenezuela, RBVietnamWorldYemen, Rep.ZambiaZimbabwe La ligne de temps
Cette échelle de temps montre un graphique de 1972 année à 2014 année South Africa. Les données jusqu'à 1971 année ne sont pas présentés. Quantité d'observations actuelles selon dates: 43.
Source (désignation):
Les indicateurs du développement mondiale
Source (organisation):
IEA Statistics © OECD/IEA 2014 (http://www.iea.org/stats/index.asp), subject to https://www.iea.org/t&c/termsandconditions/
Catégories:
Energy & Mining, Climate Change, Environment
Dernière mise à jour
23 avr. 2017
Les indicateurs de changement de valeurs selon les années
Maximum:
578.0 mln.
1 janv. 2014
Pour la date d''observation
Valeur
Changement absolu
Le changement par rapport à la valeur précédente
1 janv. 1997
60.0 mln.
+60.0 mln.
%
1 janv. 1998
146.0 mln.
+86.0 mln.
143.33%
1 janv. 1999
231.0 mln.
+85.0 mln.
58.22%
1 janv. 2000
197.0 mln.
-34.0 mln.
-14.72%
1 janv. 2001
307.0 mln.
+110.0 mln.
55.84%
1 janv. 2002
307.0 mln.
0.0
0.0%
1 janv. 2003
259.0 mln.
-48.0 mln.
-15.64%
1 janv. 2004
265.0 mln.
+6.0 mln.
2.32%
1 janv. 2005
274.0 mln.
+9.0 mln.
3.4%
1 janv. 2006
277.0 mln.
+3.0 mln.
1.09%
1 janv. 2007
281.0 mln.
+4.0 mln.
1.44%
1 janv. 2008
285.0 mln.
+4.0 mln.
1.42%
1 janv. 2009
298.0 mln.
+13.0 mln.
4.56%
1 janv. 2010
311.0 mln.
+13.0 mln.
4.36%
1 janv. 2011
319.0 mln.
+8.0 mln.
2.57%
1 janv. 2012
327.0 mln.
+8.0 mln.
2.51%
1 janv. 2013
369.0 mln.
+42.0 mln.
12.84%
1 janv. 2014
578.0 mln.
+209.0 mln.
56.64%
Classement des pays selon les statistiques actuelles par années


Commentaires: