29
/fr/
fr
AIzaSyAYiBZKx7MnpbEhh9jyipgxe19OcubqV5w
April 1, 2024
245194
South Africa
ZAF
true
2
1
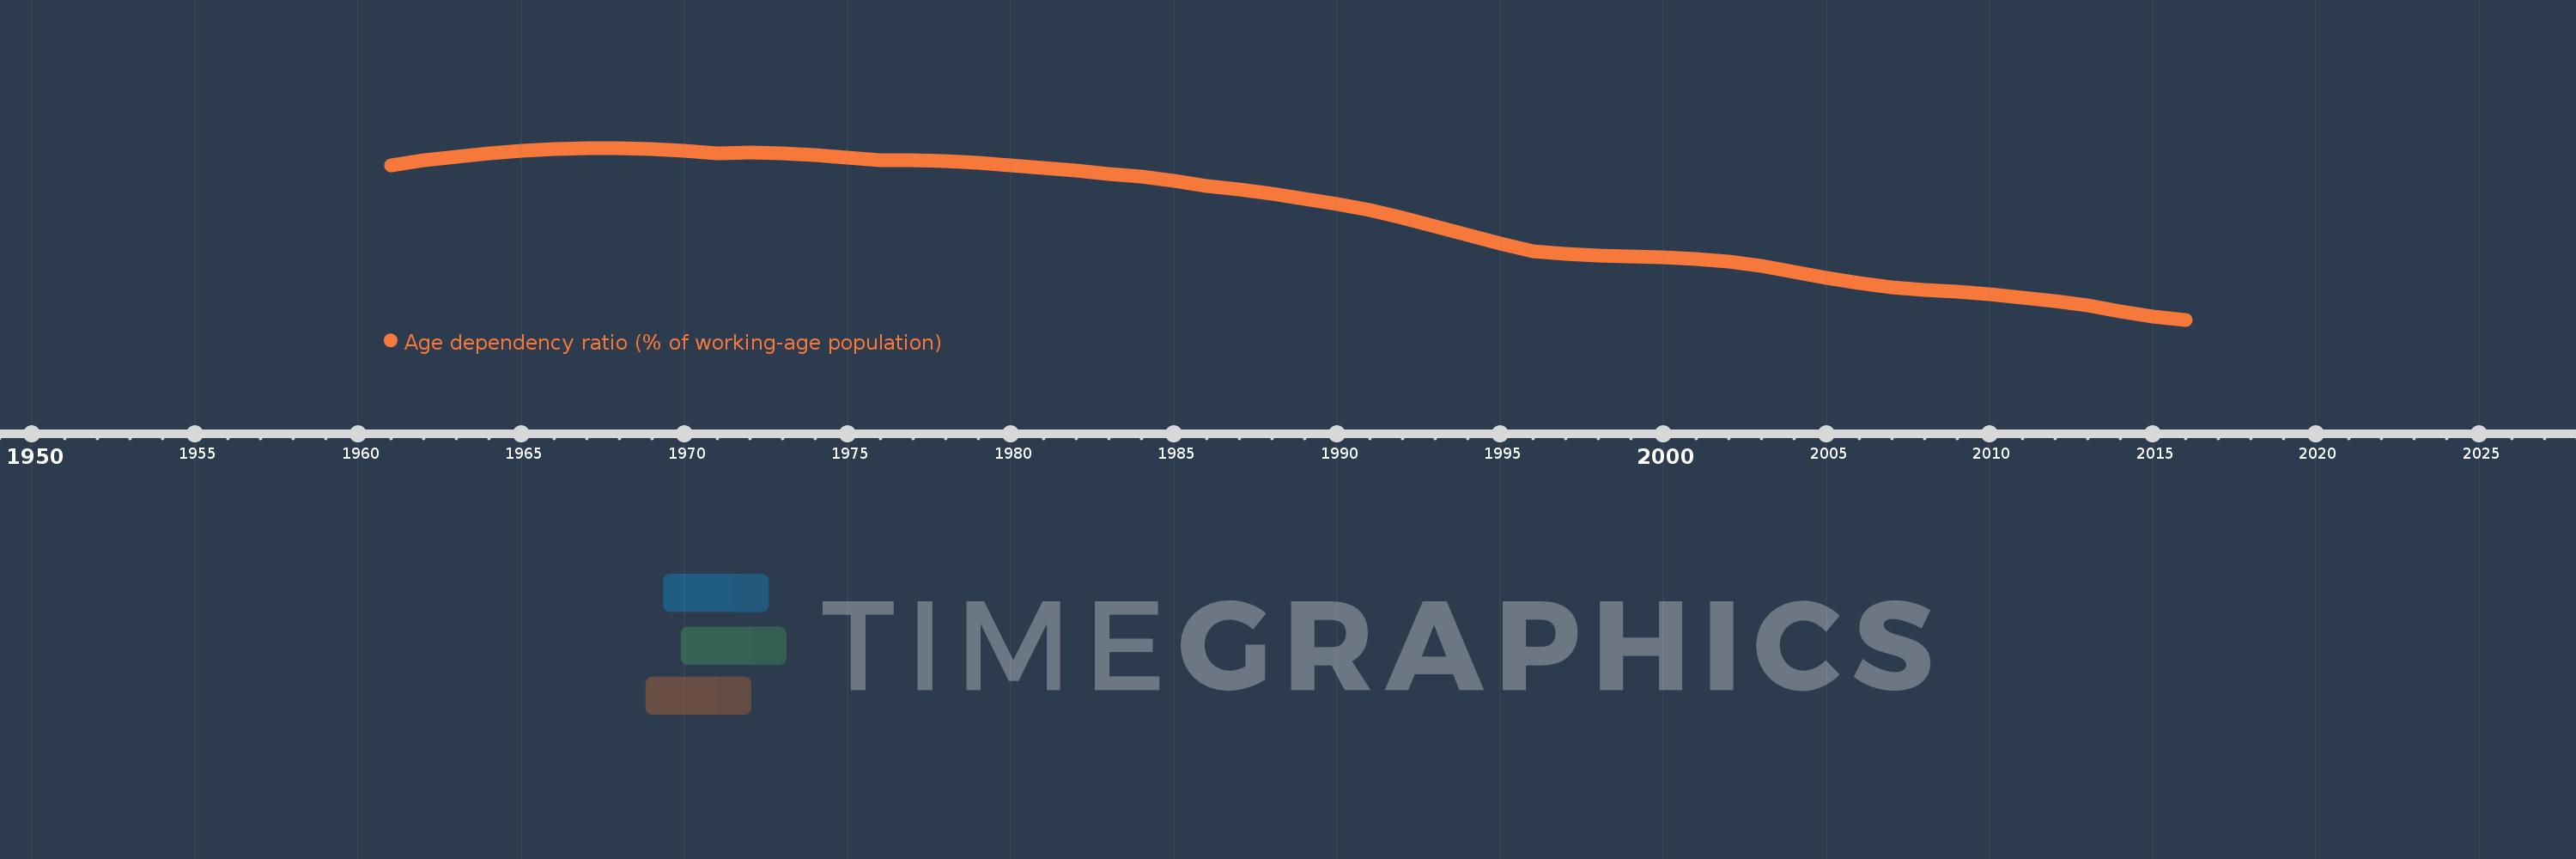
Age dependency ratio (% of working-age population)
2016,2015,2014,2013,2012,2011,2010,2009,2008,2007,2006,2005,2004,2003,2002,2001,2000,1999,1998,1997,1996,1995,1994,1993,1992,1991,1990,1989,1988,1987,1986,1985,1984,1983,1982,1981,1980,1979,1978,1977,1976,1975,1974,1973,1972,1971,1970,1969,1968,1967,1966,1965,1964,1963,1962,1961
Cette statistique dans les autres pays:
AfghanistanAlbaniaAlgeriaAngolaAntigua and BarbudaArab WorldArgentinaArmeniaArubaAustraliaAustriaAzerbaijanBahamas, TheBahrainBangladeshBarbadosBelarusBelgiumBelizeBeninBhutanBoliviaBosnia and HerzegovinaBotswanaBrazilBrunei DarussalamBulgariaBurkina FasoBurundiCabo VerdeCambodiaCameroonCanadaCaribbean small statesCentral African RepublicCentral Europe and the BalticsChadChannel IslandsChileChinaColombiaComorosCongo, Dem. Rep.Congo, Rep.Costa RicaCote d'IvoireCroatiaCubaCuracaoCyprusCzech RepublicDenmarkDjiboutiDominican RepublicEarly-demographic dividendEast Asia & PacificEast Asia & Pacific (excluding high income)East Asia & Pacific (IDA & IBRD countries)EcuadorEgypt, Arab Rep.El SalvadorEquatorial GuineaEritreaEstoniaEthiopiaEuro areaEurope & Central AsiaEurope & Central Asia (excluding high income)Europe & Central Asia (IDA & IBRD countries)European UnionFijiFinlandFragile and conflict affected situationsFranceFrench PolynesiaGabonGambia, TheGeorgiaGermanyGhanaGreeceGrenadaGuamGuatemalaGuineaGuinea-BissauGuyanaHaitiHeavily indebted poor countries (HIPC)High incomeHondurasHong Kong SAR, ChinaHungaryIBRD onlyIcelandIDA & IBRD totalIDA blendIDA onlyIDA totalIndiaIndonesiaIran, Islamic Rep.IraqIrelandIsraelItalyJamaicaJapanJordanKazakhstanKenyaKiribatiKorea, Dem. People’s Rep.Korea, Rep.KosovoKuwaitKyrgyz RepublicLao PDRLate-demographic dividendLatin America & Caribbean Latin America & Caribbean (excluding high income)Latin America & the Caribbean (IDA & IBRD countries)LatviaLeast developed countries: UN classificationLebanonLesothoLiberiaLibyaLithuaniaLow & middle incomeLow incomeLower middle incomeLuxembourgMacao SAR, ChinaMacedonia, FYRMadagascarMalawiMalaysiaMaldivesMaliMaltaMauritaniaMauritiusMexicoMicronesia, Fed. Sts.Middle East & North AfricaMiddle East & North Africa (excluding high income)Middle East & North Africa (IDA & IBRD countries)Middle incomeMoldovaMongoliaMontenegroMoroccoMozambiqueMyanmarNamibiaNepalNetherlandsNew CaledoniaNew ZealandNicaraguaNigerNigeriaNorth AmericaNorwayOECD membersOmanOther small statesPacific island small statesPakistanPanamaPapua New GuineaParaguayPeruPhilippinesPolandPortugalPost-demographic dividendPre-demographic dividendPuerto RicoQatarRomaniaRussian FederationRwandaSamoaSao Tome and PrincipeSaudi ArabiaSenegalSerbiaSeychellesSierra LeoneSingaporeSlovak RepublicSloveniaSmall statesSolomon IslandsSomaliaSouth AfricaSouth AsiaSouth Asia (IDA & IBRD)South SudanSpainSri LankaSt. LuciaSt. Vincent and the GrenadinesSub-Saharan Africa Sub-Saharan Africa (excluding high income)Sub-Saharan Africa (IDA & IBRD countries)SudanSurinameSwazilandSwedenSwitzerlandSyrian Arab RepublicTajikistanTanzaniaThailandTimor-LesteTogoTongaTrinidad and TobagoTunisiaTurkeyTurkmenistanUgandaUkraineUnited Arab EmiratesUnited KingdomUnited StatesUpper middle incomeUruguayUzbekistanVanuatuVenezuela, RBVietnamVirgin Islands (U.S.)West Bank and GazaWorldYemen, Rep.ZambiaZimbabwe La ligne de temps
Cette échelle de temps montre un graphique de 1961 année à 2016 année South Africa. Les données jusqu'à 1960 année ne sont pas présentés. Quantité d'observations actuelles selon dates: 56.
Source (désignation):
Les indicateurs du développement mondiale
Source (organisation):
World Bank staff estimates using the World Bank's population and age distributions of the United Nations Population Division's World Population Prospects. The World Bank's population estimates are from various sources including the United Nations Population Division's World Population Prospects; census reports and statistical publications from national statistical offices; Eurostat's Demographic Statistics; United Nations Statistical Division, Population and Vital Statistics Report (various years); U.S. Census Bureau: International Database; and Secretariat of the Pacific Community, Statistics and Demography Programme.
Catégories:
Health
Dernière mise à jour
23 avr. 2017
Les indicateurs de changement de valeurs selon les années
Minimum:
52.144
1 janv. 2016
Maximum:
84.491
1 janv. 1967
Pour la date d''observation
Valeur
Changement absolu
Le changement par rapport à la valeur précédente
1 janv. 1961
81.186
+81.186
0.0%
1 janv. 1962
82.102
+0.916
1.13%
1 janv. 1963
82.879
+0.777
0.95%
1 janv. 1964
83.531
+0.652
0.79%
1 janv. 1965
84.021
+0.489
0.59%
1 janv. 1966
84.312
+0.291
0.35%
1 janv. 1967
84.491
+0.179
0.21%
1 janv. 1968
84.483
-0.008
-0.01%
1 janv. 1969
84.302
-0.18
-0.21%
1 janv. 1970
83.973
-0.329
-0.39%
1 janv. 1971
83.529
-0.444
-0.53%
1 janv. 1972
83.571
+0.042
0.05%
1 janv. 1973
83.399
-0.171
-0.21%
1 janv. 1974
83.076
-0.323
-0.39%
1 janv. 1975
82.655
-0.42
-0.51%
1 janv. 1976
82.154
-0.501
-0.61%
1 janv. 1977
82.138
-0.017
-0.02%
1 janv. 1978
81.949
-0.189
-0.23%
1 janv. 1979
81.621
-0.328
-0.4%
1 janv. 1980
81.188
-0.433
-0.53%
1 janv. 1981
80.669
-0.518
-0.64%
1 janv. 1982
80.19
-0.479
-0.59%
1 janv. 1983
79.665
-0.526
-0.66%
1 janv. 1984
79.044
-0.621
-0.78%
1 janv. 1985
78.259
-0.785
-0.99%
1 janv. 1986
77.288
-0.97
-1.24%
1 janv. 1987
76.726
-0.562
-0.73%
1 janv. 1988
75.931
-0.796
-1.04%
1 janv. 1989
74.968
-0.963
-1.27%
1 janv. 1990
73.914
-1.054
-1.41%
1 janv. 1991
72.797
-1.117
-1.51%
1 janv. 1992
71.301
-1.496
-2.05%
1 janv. 1993
69.717
-1.584
-2.22%
1 janv. 1994
68.095
-1.622
-2.33%
1 janv. 1995
66.507
-1.588
-2.33%
1 janv. 1996
65.019
-1.488
-2.24%
1 janv. 1997
64.479
-0.539
-0.83%
1 janv. 1998
64.201
-0.278
-0.43%
1 janv. 1999
64.065
-0.136
-0.21%
1 janv. 2000
63.883
-0.182
-0.28%
1 janv. 2001
63.525
-0.358
-0.56%
1 janv. 2002
63.11
-0.415
-0.65%
1 janv. 2003
62.258
-0.852
-1.35%
1 janv. 2004
61.141
-1.118
-1.8%
1 janv. 2005
60.032
-1.108
-1.81%
1 janv. 2006
59.091
-0.941
-1.57%
1 janv. 2007
58.25
-0.84
-1.42%
1 janv. 2008
57.737
-0.514
-0.88%
1 janv. 2009
57.389
-0.348
-0.6%
1 janv. 2010
56.927
-0.462
-0.8%
1 janv. 2011
56.227
-0.701
-1.23%
1 janv. 2012
55.708
-0.518
-0.92%
1 janv. 2013
54.802
-0.906
-1.63%
1 janv. 2014
53.728
-1.074
-1.96%
1 janv. 2015
52.798
-0.93
-1.73%
1 janv. 2016
52.144
-0.655
-1.24%
Classement des pays selon les statistiques actuelles par années


Commentaires: