29
/fr/
fr
AIzaSyAYiBZKx7MnpbEhh9jyipgxe19OcubqV5w
April 1, 2024
241514
Slovak Republic
SVK
true
2
1
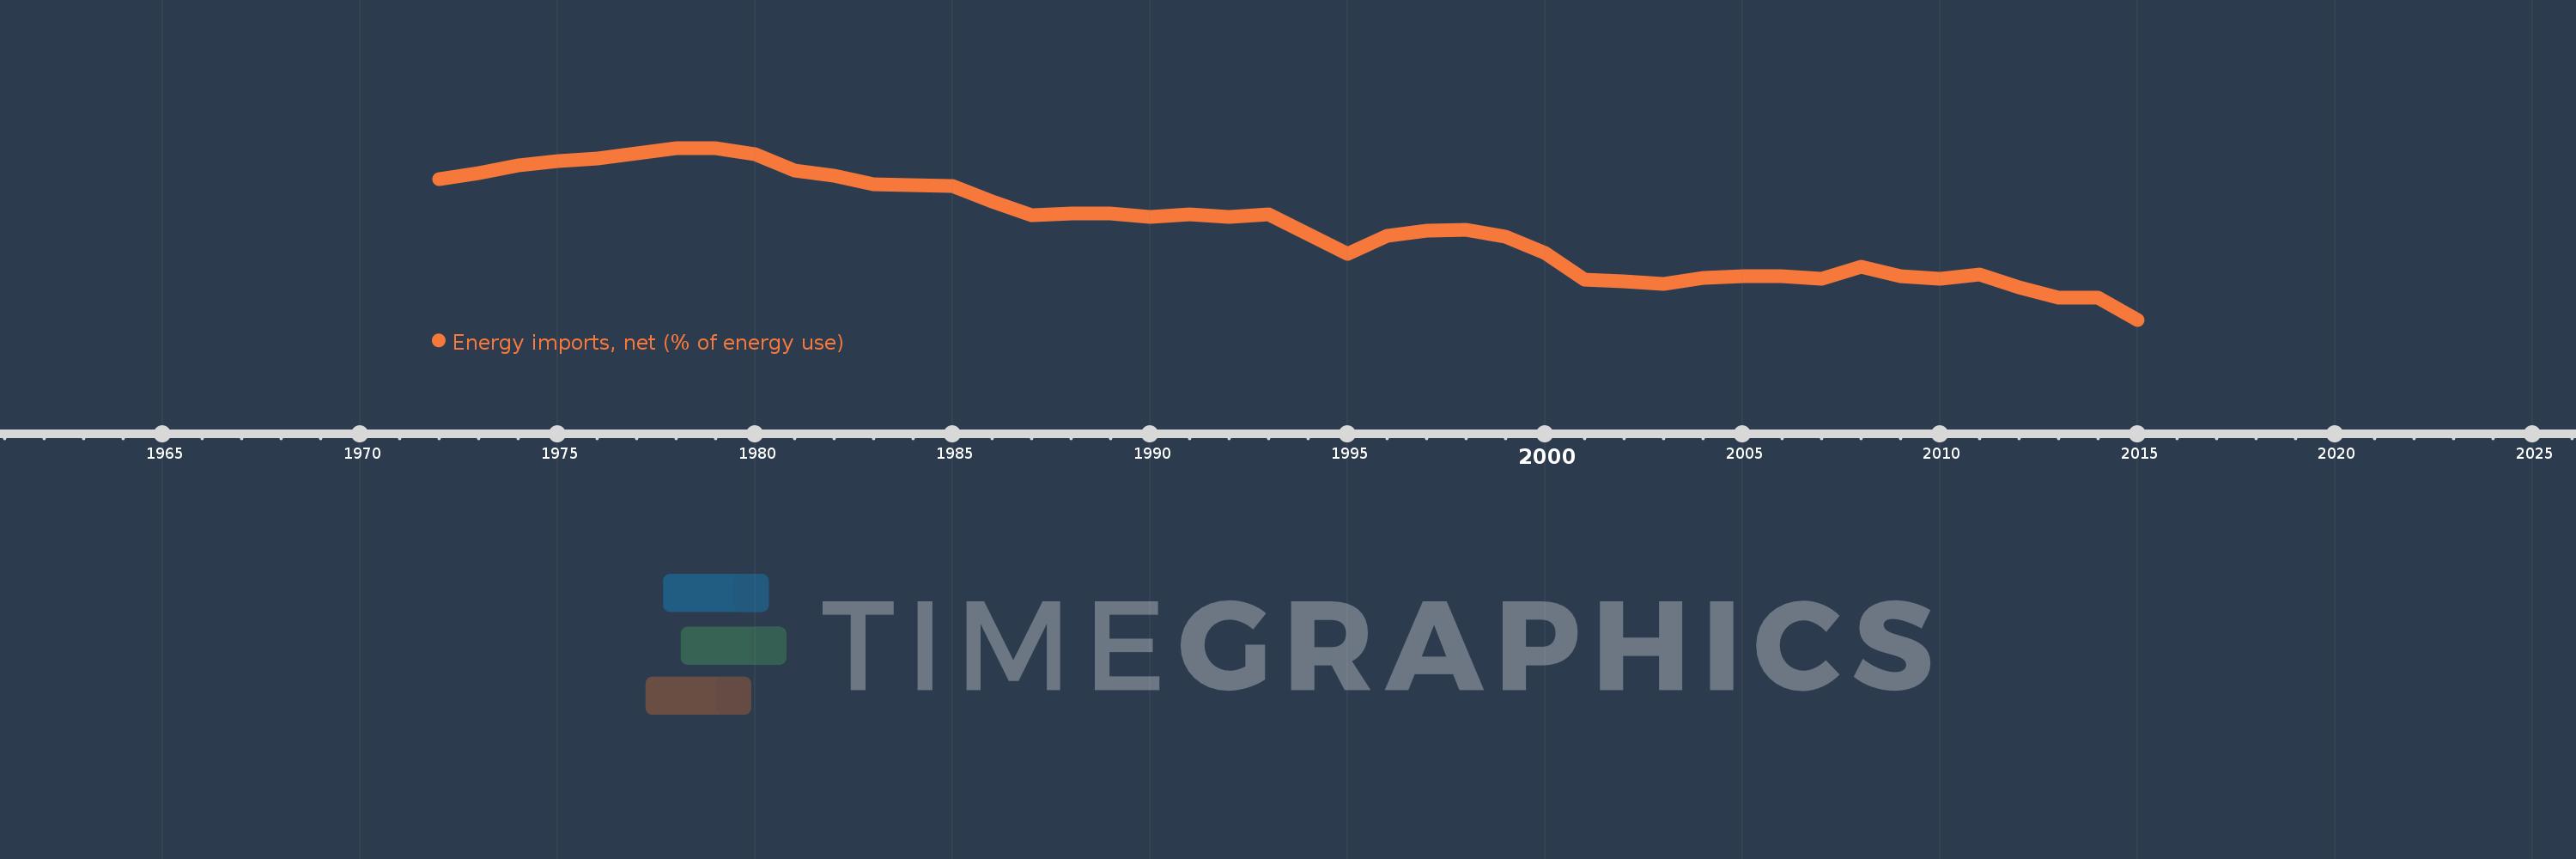
Energy imports, net (% of energy use)
2015,2014,2013,2012,2011,2010,2009,2008,2007,2006,2005,2004,2003,2002,2001,2000,1999,1998,1997,1996,1995,1994,1993,1992,1991,1990,1989,1988,1987,1986,1985,1984,1983,1982,1981,1980,1979,1978,1977,1976,1975,1974,1973,1972
Cette statistique dans les autres pays:
AlbaniaAlgeriaAngolaArab WorldArgentinaArmeniaAustraliaAustriaAzerbaijanBahrainBangladeshBelarusBelgiumBeninBoliviaBosnia and HerzegovinaBotswanaBrazilBrunei DarussalamBulgariaCambodiaCameroonCanadaCaribbean small statesCentral Europe and the BalticsChileChinaColombiaCongo, Dem. Rep.Congo, Rep.Costa RicaCote d'IvoireCroatiaCubaCuracaoCyprusCzech RepublicDenmarkDominican RepublicEarly-demographic dividendEast Asia & PacificEast Asia & Pacific (excluding high income)East Asia & Pacific (IDA & IBRD countries)EcuadorEgypt, Arab Rep.El SalvadorEritreaEstoniaEthiopiaEuro areaEurope & Central AsiaEurope & Central Asia (excluding high income)Europe & Central Asia (IDA & IBRD countries)European UnionFinlandFragile and conflict affected situationsFranceGabonGeorgiaGermanyGhanaGibraltarGreeceGuatemalaHaitiHeavily indebted poor countries (HIPC)High incomeHondurasHong Kong SAR, ChinaHungaryIBRD onlyIcelandIDA & IBRD totalIDA blendIDA onlyIDA totalIndiaIndonesiaIran, Islamic Rep.IraqIrelandIsraelItalyJamaicaJapanJordanKazakhstanKenyaKorea, Dem. People’s Rep.Korea, Rep.KosovoKuwaitKyrgyz RepublicLate-demographic dividendLatin America & Caribbean Latin America & Caribbean (excluding high income)Latin America & the Caribbean (IDA & IBRD countries)LatviaLeast developed countries: UN classificationLebanonLibyaLithuaniaLow & middle incomeLow incomeLower middle incomeLuxembourgMacedonia, FYRMalaysiaMaltaMauritiusMexicoMiddle East & North AfricaMiddle East & North Africa (excluding high income)Middle East & North Africa (IDA & IBRD countries)Middle incomeMoldovaMongoliaMontenegroMoroccoMozambiqueMyanmarNamibiaNepalNetherlandsNew ZealandNicaraguaNigerNigeriaNorth AmericaNorwayOECD membersOmanOther small statesPakistanPanamaParaguayPeruPhilippinesPolandPortugalPost-demographic dividendPre-demographic dividendQatarRomaniaRussian FederationSaudi ArabiaSenegalSerbiaSingaporeSlovak RepublicSloveniaSmall statesSouth AfricaSouth AsiaSouth Asia (IDA & IBRD)South SudanSpainSri LankaSub-Saharan Africa Sub-Saharan Africa (excluding high income)Sub-Saharan Africa (IDA & IBRD countries)SudanSwedenSwitzerlandSyrian Arab RepublicTajikistanTanzaniaThailandTogoTrinidad and TobagoTunisiaTurkeyTurkmenistanUkraineUnited Arab EmiratesUnited KingdomUnited StatesUpper middle incomeUruguayUzbekistanVenezuela, RBVietnamWorldYemen, Rep.ZambiaZimbabwe La ligne de temps
Cette échelle de temps montre un graphique de 1972 année à 2015 année Slovak Republic. Les données jusqu'à 1971 année ne sont pas présentés. Quantité d'observations actuelles selon dates: 44.
Source (désignation):
Les indicateurs du développement mondiale
Source (organisation):
IEA Statistics © OECD/IEA 2014 (http://www.iea.org/stats/index.asp), subject to https://www.iea.org/t&c/termsandconditions/
Catégories:
Energy & Mining, Trade
Dernière mise à jour
23 avr. 2017
Les indicateurs de changement de valeurs selon les années
Minimum:
57.638
1 janv. 2015
Maximum:
86.316
1 janv. 1978
Pour la date d''observation
Valeur
Changement absolu
Le changement par rapport à la valeur précédente
1 janv. 1972
81.134
+81.134
0.0%
1 janv. 1973
82.085
+0.951
1.17%
1 janv. 1974
83.408
+1.323
1.61%
1 janv. 1975
84.059
+0.65
0.78%
1 janv. 1976
84.539
+0.481
0.57%
1 janv. 1977
85.426
+0.887
1.05%
1 janv. 1978
86.316
+0.89
1.04%
1 janv. 1979
86.316
0.0
0.0%
1 janv. 1980
85.225
-1.091
-1.26%
1 janv. 1981
82.529
-2.695
-3.16%
1 janv. 1982
81.701
-0.828
-1.0%
1 janv. 1983
80.301
-1.4
-1.71%
1 janv. 1984
80.04
-0.26
-0.32%
1 janv. 1985
79.94
-0.1
-0.12%
1 janv. 1986
77.411
-2.529
-3.16%
1 janv. 1987
75.063
-2.348
-3.03%
1 janv. 1988
75.418
+0.355
0.47%
1 janv. 1989
75.412
-0.005
-0.01%
1 janv. 1990
74.828
-0.584
-0.77%
1 janv. 1991
75.224
+0.396
0.53%
1 janv. 1992
74.75
-0.474
-0.63%
1 janv. 1993
75.226
+0.476
0.64%
1 janv. 1994
71.912
-3.315
-4.41%
1 janv. 1995
68.585
-3.326
-4.63%
1 janv. 1996
71.628
+3.042
4.44%
1 janv. 1997
72.461
+0.833
1.16%
1 janv. 1998
72.663
+0.202
0.28%
1 janv. 1999
71.559
-1.104
-1.52%
1 janv. 2000
68.77
-2.789
-3.9%
1 janv. 2001
64.345
-4.425
-6.44%
1 janv. 2002
64.048
-0.297
-0.46%
1 janv. 2003
63.587
-0.461
-0.72%
1 janv. 2004
64.644
+1.057
1.66%
1 janv. 2005
64.845
+0.201
0.31%
1 janv. 2006
64.899
+0.054
0.08%
1 janv. 2007
64.49
-0.41
-0.63%
1 janv. 2008
66.528
+2.039
3.16%
1 janv. 2009
64.956
-1.572
-2.36%
1 janv. 2010
64.526
-0.43
-0.66%
1 janv. 2011
65.185
+0.659
1.02%
1 janv. 2012
63.015
-2.169
-3.33%
1 janv. 2013
61.291
-1.724
-2.74%
1 janv. 2014
61.266
-0.025
-0.04%
1 janv. 2015
57.638
-3.629
-5.92%
Classement des pays selon les statistiques actuelles par années


Commentaires: