29
/fr/
fr
AIzaSyAYiBZKx7MnpbEhh9jyipgxe19OcubqV5w
April 1, 2024
240761
Singapore
SGP
true
2
1
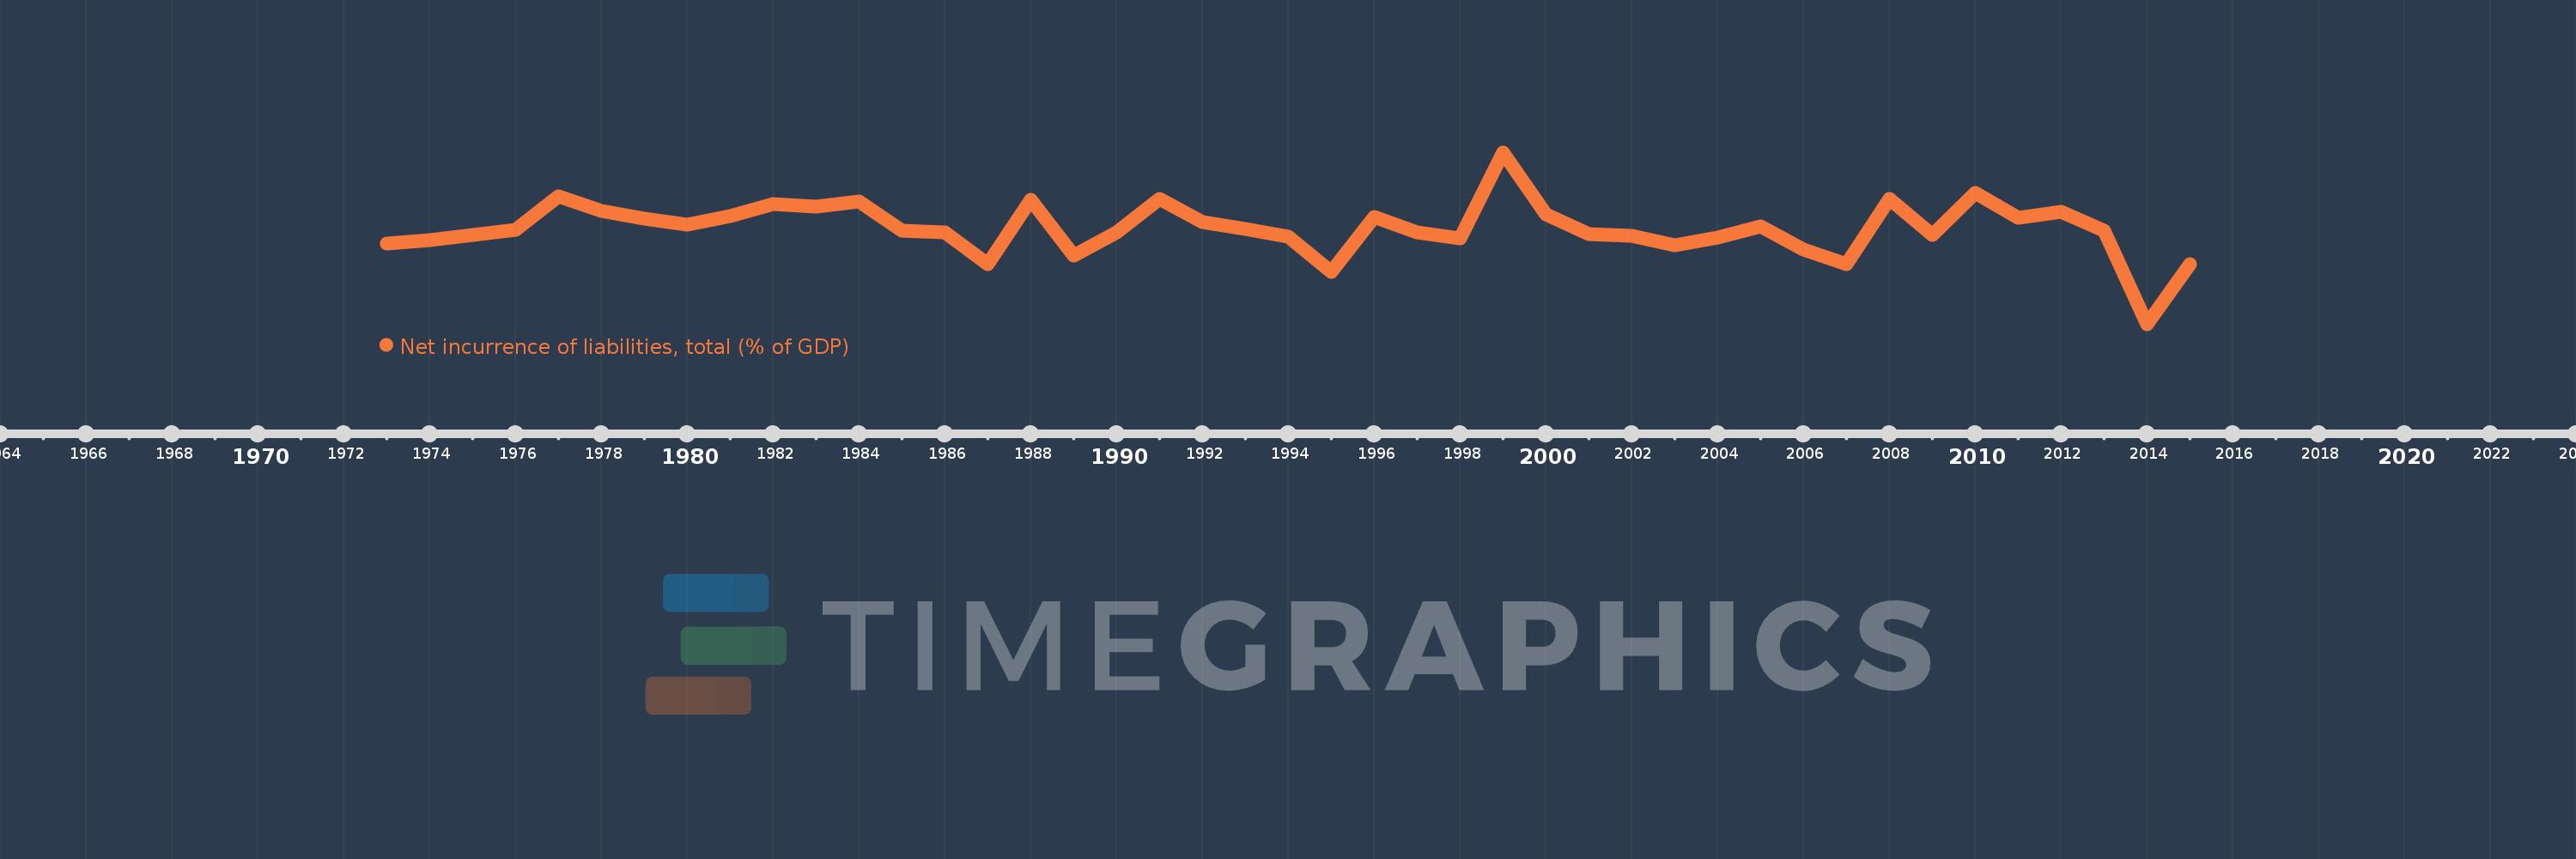
Net incurrence of liabilities, total (% of GDP)
2015,2014,2013,2012,2011,2010,2009,2008,2007,2006,2005,2004,2003,2002,2001,2000,1999,1998,1997,1996,1995,1994,1993,1992,1991,1990,1989,1988,1987,1986,1985,1984,1983,1982,1981,1980,1979,1978,1977,1976,1975,1974,1973
Cette statistique dans les autres pays:
La ligne de temps
Cette échelle de temps montre un graphique de 1973 année à 2015 année Singapore. Les données jusqu'à 1972 année ne sont pas présentés. Quantité d'observations actuelles selon dates: 43.
Source (désignation):
Les indicateurs du développement mondiale
Source (organisation):
International Monetary Fund, Government Finance Statistics Yearbook and data files.
Catégories:
Public Sector
Dernière mise à jour
23 avr. 2017
Les indicateurs de changement de valeurs selon les années
Minimum:
-3.965
1 janv. 2014
Maximum:
18.191
1 janv. 1999
Pour la date d''observation
Valeur
Changement absolu
Le changement par rapport à la valeur précédente
1 janv. 1973
6.399
+6.399
0.0%
1 janv. 1974
6.892
+0.493
7.7%
1 janv. 1975
7.582
+0.69
10.01%
1 janv. 1976
8.239
+0.657
8.66%
1 janv. 1977
12.558
+4.32
52.43%
1 janv. 1978
10.617
-1.941
-15.46%
1 janv. 1979
9.687
-0.93
-8.76%
1 janv. 1980
8.866
-0.82
-8.47%
1 janv. 1981
10.033
+1.167
13.16%
1 janv. 1982
11.584
+1.55
15.45%
1 janv. 1983
11.151
-0.432
-3.73%
1 janv. 1984
11.827
+0.676
6.06%
1 janv. 1985
8.115
-3.713
-31.39%
1 janv. 1986
7.892
-0.222
-2.74%
1 janv. 1987
3.728
-4.165
-52.77%
1 janv. 1988
12.076
+8.348
223.94%
1 janv. 1989
4.923
-7.153
-59.23%
1 janv. 1990
7.902
+2.979
60.51%
1 janv. 1991
12.185
+4.282
54.19%
1 janv. 1992
9.164
-3.021
-24.79%
1 janv. 1993
8.36
-0.804
-8.77%
1 janv. 1994
7.312
-1.048
-12.54%
1 janv. 1995
2.793
-4.519
-61.81%
1 janv. 1996
9.877
+7.084
253.67%
1 janv. 1997
7.857
-2.02
-20.45%
1 janv. 1998
7.115
-0.742
-9.45%
1 janv. 1999
18.191
+11.076
155.69%
1 janv. 2000
10.235
-7.956
-43.74%
1 janv. 2001
7.709
-2.526
-24.68%
1 janv. 2002
7.436
-0.272
-3.53%
1 janv. 2003
6.269
-1.167
-15.69%
1 janv. 2004
7.174
+0.904
14.43%
1 janv. 2005
8.695
+1.521
21.21%
1 janv. 2006
5.627
-3.068
-35.28%
1 janv. 2007
3.816
-1.811
-32.18%
1 janv. 2008
12.149
+8.333
218.35%
1 janv. 2009
7.509
-4.641
-38.2%
1 janv. 2010
12.965
+5.456
72.67%
1 janv. 2011
9.719
-3.246
-25.03%
1 janv. 2012
10.533
+0.813
8.37%
1 janv. 2013
8.148
-2.384
-22.64%
1 janv. 2014
-3.965
-12.114
-148.66%
1 janv. 2015
3.775
+7.74
-195.2%
Classement des pays selon les statistiques actuelles par années


Commentaires: