29
/fr/
fr
AIzaSyAYiBZKx7MnpbEhh9jyipgxe19OcubqV5w
April 1, 2024
235828
Senegal
SEN
true
2
1
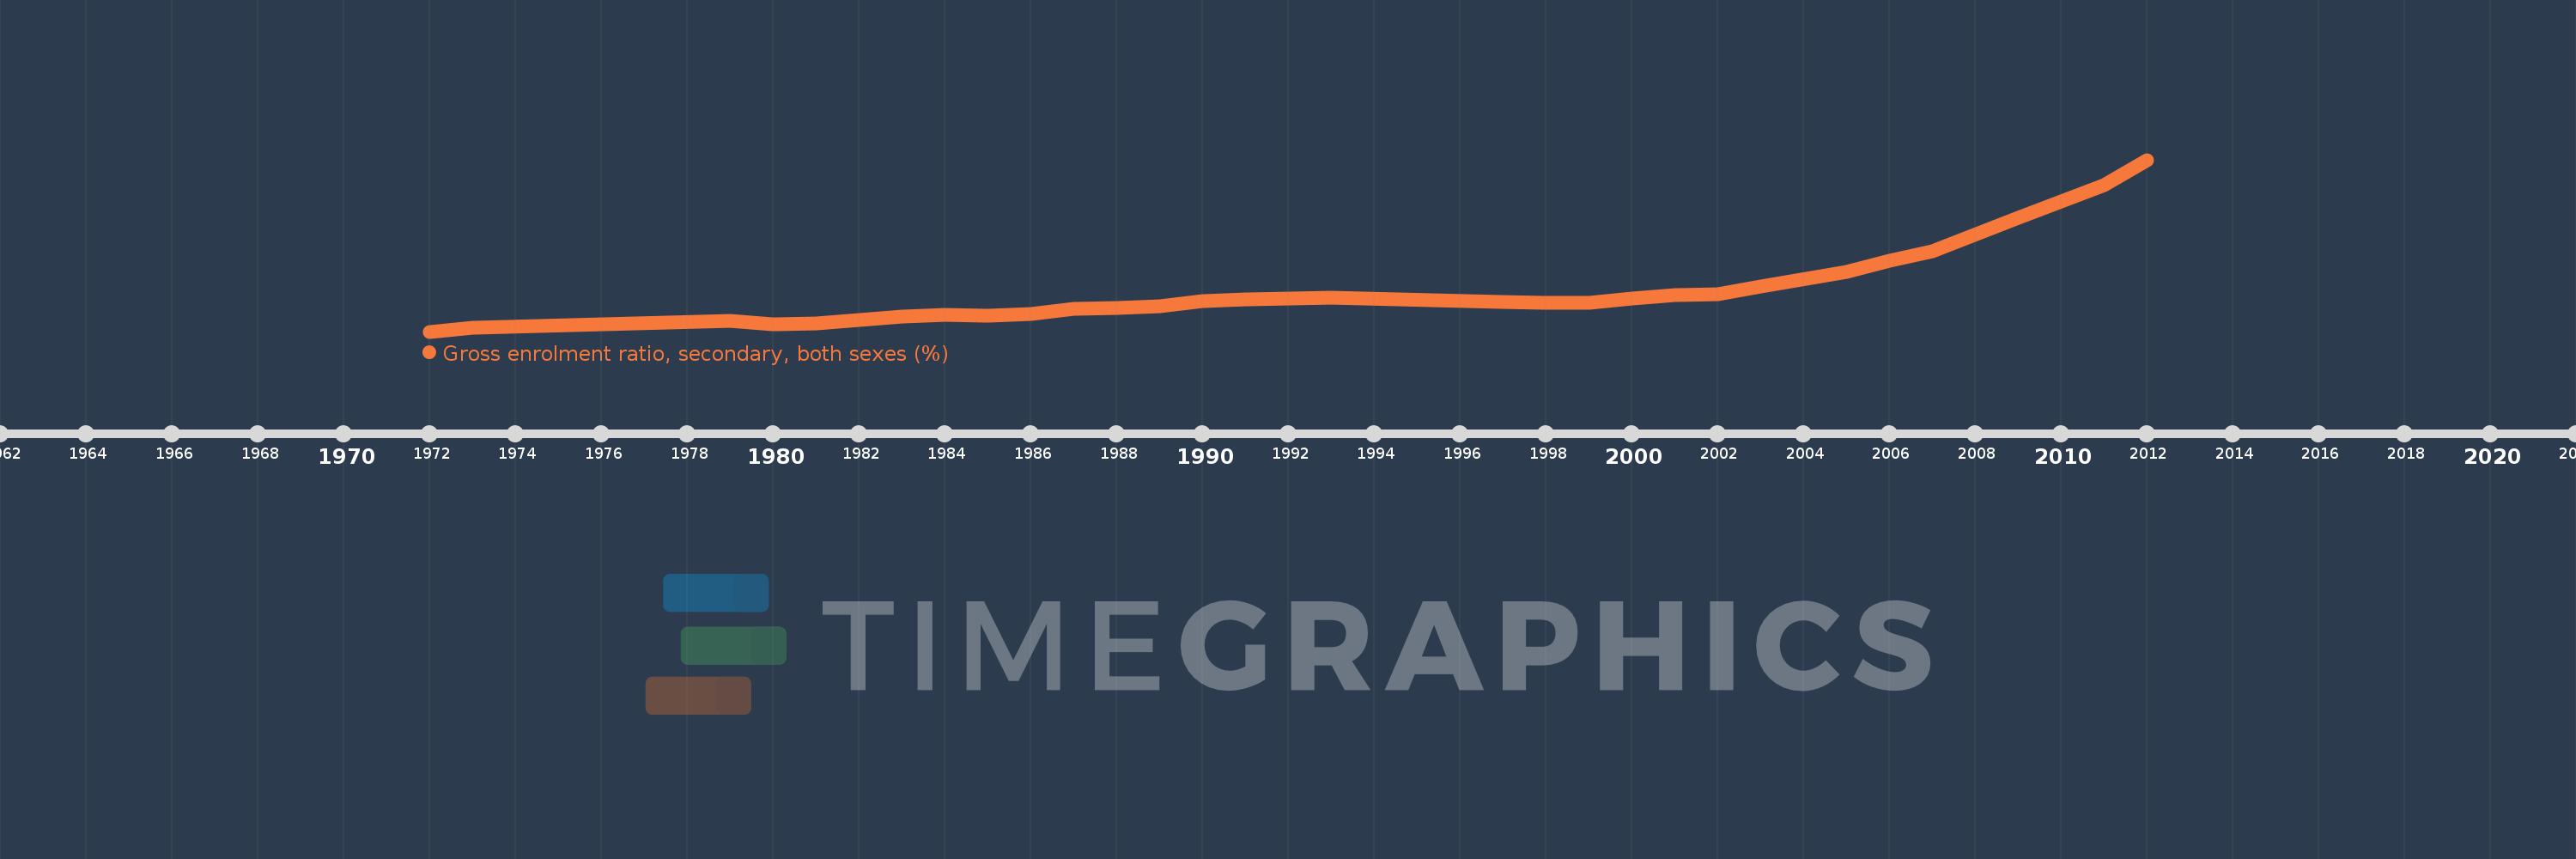
Gross enrolment ratio, secondary, both sexes (%)
2012,2011,2009,2007,2006,2005,2003,2002,2001,2000,1999,1998,1997,1993,1991,1990,1989,1988,1987,1986,1985,1984,1983,1982,1981,1980,1979,1973,1972
Cette statistique dans les autres pays:
AfghanistanAlbaniaAlgeriaAndorraAngolaAntigua and BarbudaArab WorldArgentinaArmeniaArubaAustraliaAustriaAzerbaijanBahamas, TheBahrainBangladeshBarbadosBelarusBelgiumBelizeBeninBermudaBhutanBoliviaBosnia and HerzegovinaBotswanaBrazilBritish Virgin IslandsBrunei DarussalamBulgariaBurkina FasoBurundiCabo VerdeCambodiaCameroonCanadaCaribbean small statesCentral African RepublicCentral Europe and the BalticsChadChileChinaColombiaComorosCongo, Dem. Rep.Congo, Rep.Costa RicaCote d'IvoireCroatiaCubaCuracaoCyprusCzech RepublicDenmarkDjiboutiDominicaDominican RepublicEarly-demographic dividendEast Asia & PacificEast Asia & Pacific (excluding high income)East Asia & Pacific (IDA & IBRD countries)EcuadorEgypt, Arab Rep.El SalvadorEquatorial GuineaEritreaEstoniaEthiopiaEuro areaEurope & Central AsiaEurope & Central Asia (excluding high income)Europe & Central Asia (IDA & IBRD countries)European UnionFijiFinlandFragile and conflict affected situationsFranceGabonGambia, TheGeorgiaGermanyGhanaGreeceGrenadaGuatemalaGuineaGuinea-BissauGuyanaHaitiHeavily indebted poor countries (HIPC)High incomeHondurasHong Kong SAR, ChinaHungaryIBRD onlyIcelandIDA & IBRD totalIDA blendIDA onlyIDA totalIndiaIndonesiaIran, Islamic Rep.IraqIrelandIsraelItalyJamaicaJapanJordanKazakhstanKenyaKiribatiKorea, Dem. People’s Rep.Korea, Rep.KuwaitKyrgyz RepublicLao PDRLate-demographic dividendLatin America & Caribbean Latin America & Caribbean (excluding high income)Latin America & the Caribbean (IDA & IBRD countries)LatviaLeast developed countries: UN classificationLebanonLesothoLiberiaLibyaLiechtensteinLithuaniaLow & middle incomeLow incomeLower middle incomeLuxembourgMacao SAR, ChinaMacedonia, FYRMadagascarMalawiMalaysiaMaldivesMaliMaltaMarshall IslandsMauritaniaMauritiusMexicoMicronesia, Fed. Sts.Middle East & North AfricaMiddle East & North Africa (excluding high income)Middle East & North Africa (IDA & IBRD countries)Middle incomeMoldovaMongoliaMontenegroMoroccoMozambiqueMyanmarNamibiaNauruNepalNetherlandsNew ZealandNicaraguaNigerNigeriaNorth AmericaNorwayOECD membersOmanOther small statesPacific island small statesPakistanPalauPanamaPapua New GuineaParaguayPeruPhilippinesPolandPortugalPost-demographic dividendPre-demographic dividendPuerto RicoQatarRomaniaRussian FederationRwandaSamoaSan MarinoSao Tome and PrincipeSaudi ArabiaSenegalSerbiaSeychellesSierra LeoneSlovak RepublicSloveniaSmall statesSolomon IslandsSomaliaSouth AfricaSouth AsiaSouth Asia (IDA & IBRD)SpainSri LankaSt. Kitts and NevisSt. LuciaSt. Vincent and the GrenadinesSub-Saharan Africa Sub-Saharan Africa (excluding high income)Sub-Saharan Africa (IDA & IBRD countries)SudanSurinameSwazilandSwedenSwitzerlandSyrian Arab RepublicTajikistanTanzaniaThailandTimor-LesteTogoTongaTrinidad and TobagoTunisiaTurkeyTurkmenistanTuvaluUgandaUkraineUnited Arab EmiratesUnited KingdomUnited StatesUpper middle incomeUruguayUzbekistanVanuatuVenezuela, RBVietnamWest Bank and GazaWorldYemen, Rep.ZambiaZimbabwe La ligne de temps
Cette échelle de temps montre un graphique de 1972 année à 2012 année Senegal. Les données jusqu'à 1971 année ne sont pas présentés. Quantité d'observations actuelles selon dates: 29.
Source (désignation):
Les indicateurs du développement mondiale
Source (organisation):
UNESCO Institute for Statistics
Catégories:
Education
Dernière mise à jour
23 avr. 2017
Les indicateurs de changement de valeurs selon les années
Minimum:
9.372
1 janv. 1972
Maximum:
40.068
1 janv. 2012
Pour la date d''observation
Valeur
Changement absolu
Le changement par rapport à la valeur précédente
1 janv. 1972
9.372
+9.372
0.0%
1 janv. 1973
10.035
+0.663
7.08%
1 janv. 1979
11.215
+1.18
11.76%
1 janv. 1980
10.636
-0.578
-5.16%
1 janv. 1981
10.818
+0.182
1.71%
1 janv. 1982
11.394
+0.576
5.32%
1 janv. 1983
12.026
+0.632
5.54%
1 janv. 1984
12.313
+0.287
2.39%
1 janv. 1985
12.241
-0.072
-0.59%
1 janv. 1986
12.556
+0.316
2.58%
1 janv. 1987
13.492
+0.936
7.45%
1 janv. 1988
13.664
+0.171
1.27%
1 janv. 1989
13.964
+0.301
2.2%
1 janv. 1990
14.853
+0.889
6.37%
1 janv. 1991
15.171
+0.318
2.14%
1 janv. 1993
15.487
+0.317
2.09%
1 janv. 1997
14.724
-0.764
-4.93%
1 janv. 1998
14.539
-0.184
-1.25%
1 janv. 1999
14.476
-0.063
-0.43%
1 janv. 2000
15.287
+0.811
5.6%
1 janv. 2001
15.847
+0.56
3.66%
1 janv. 2002
16.079
+0.231
1.46%
1 janv. 2003
17.397
+1.318
8.2%
1 janv. 2005
20.002
+2.605
14.97%
1 janv. 2006
22.017
+2.015
10.07%
1 janv. 2007
23.711
+1.694
7.69%
1 janv. 2009
29.744
+6.033
25.44%
1 janv. 2011
35.598
+5.854
19.68%
1 janv. 2012
40.068
+4.47
12.56%
Classement des pays selon les statistiques actuelles par années


Commentaires: