29
/fr/
fr
AIzaSyAYiBZKx7MnpbEhh9jyipgxe19OcubqV5w
April 1, 2024
227000
Puerto Rico
PRI
true
2
1
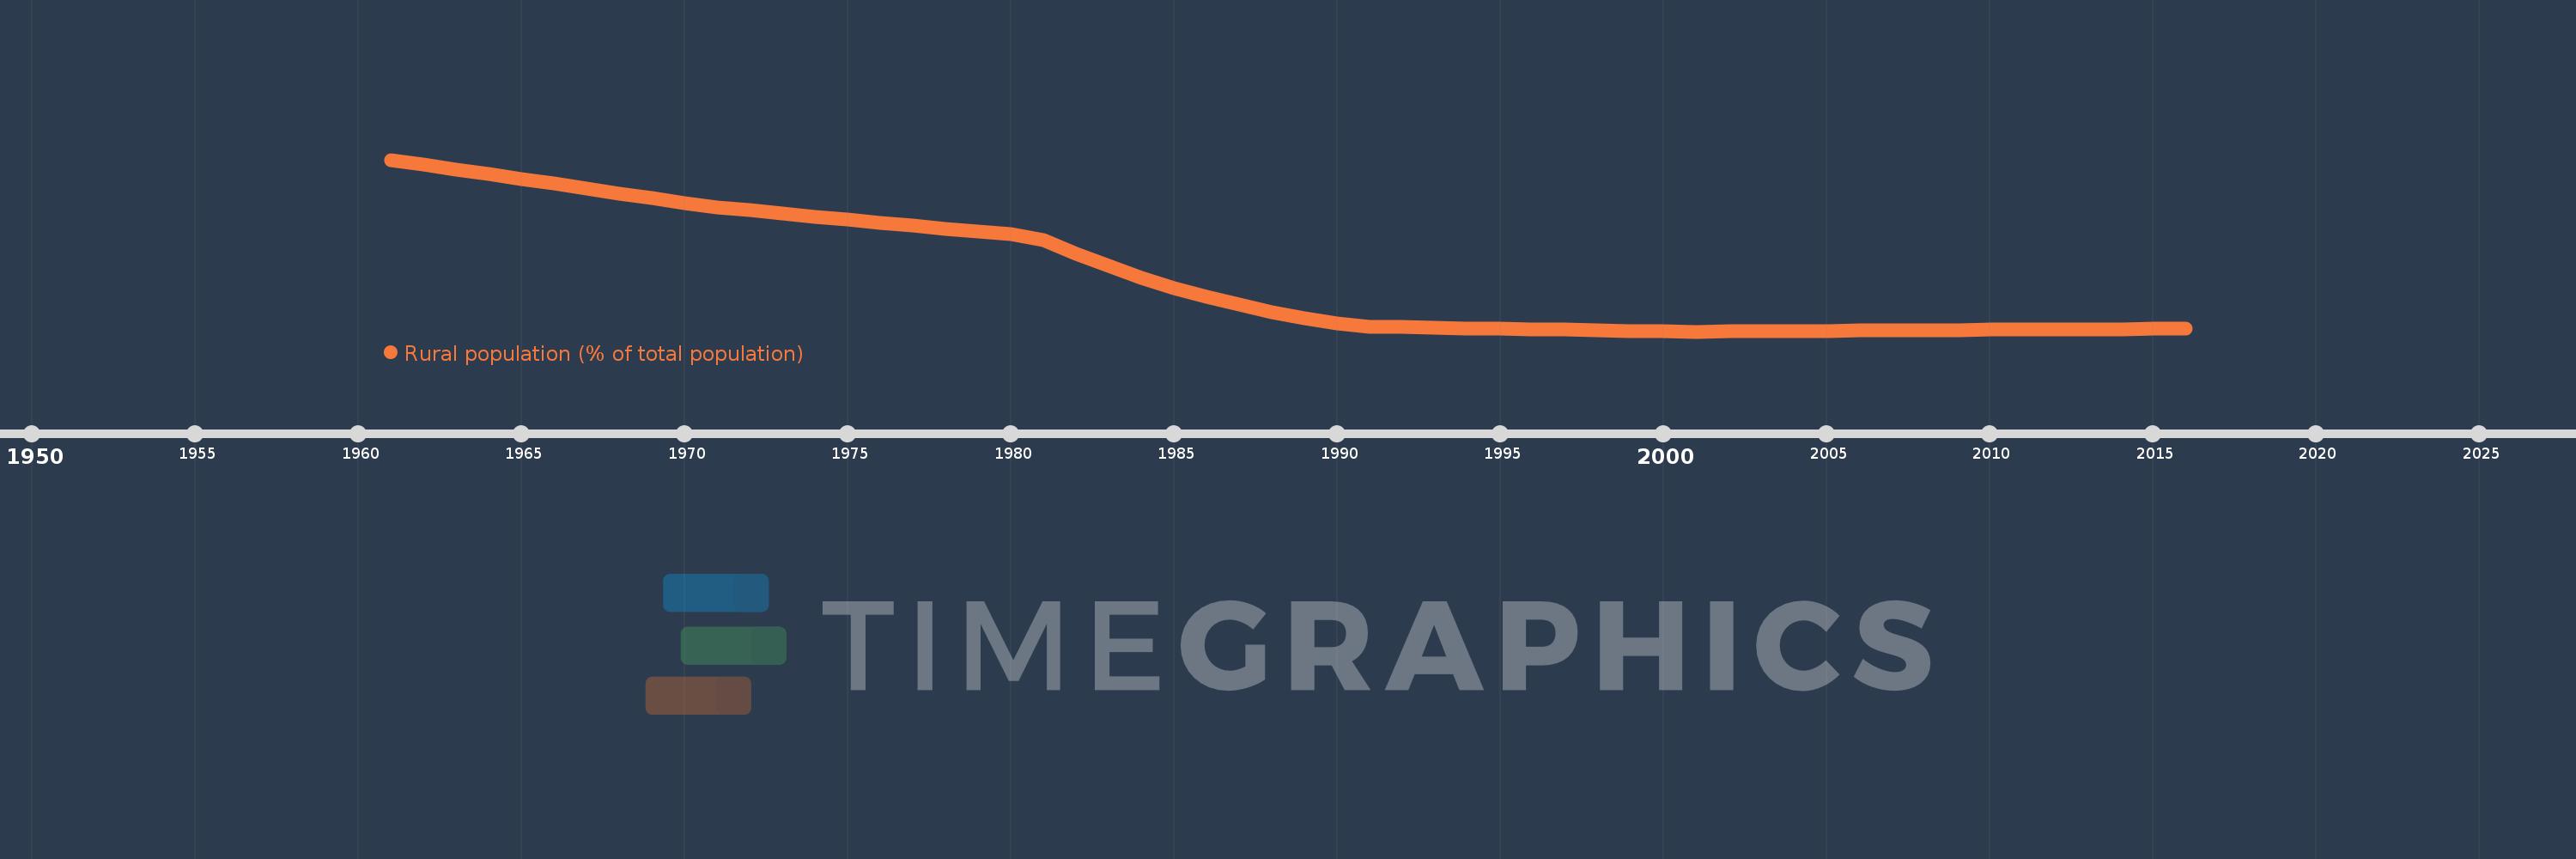
Rural population (% of total population)
2016,2015,2014,2013,2012,2011,2010,2009,2008,2007,2006,2005,2004,2003,2002,2001,2000,1999,1998,1997,1996,1995,1994,1993,1992,1991,1990,1989,1988,1987,1986,1985,1984,1983,1982,1981,1980,1979,1978,1977,1976,1975,1974,1973,1972,1971,1970,1969,1968,1967,1966,1965,1964,1963,1962,1961
Cette statistique dans les autres pays:
AfghanistanAlbaniaAlgeriaAmerican SamoaAndorraAngolaAntigua and BarbudaArab WorldArgentinaArmeniaArubaAustraliaAustriaAzerbaijanBahamas, TheBahrainBangladeshBarbadosBelarusBelgiumBelizeBeninBermudaBhutanBoliviaBosnia and HerzegovinaBotswanaBrazilBritish Virgin IslandsBrunei DarussalamBulgariaBurkina FasoBurundiCabo VerdeCambodiaCameroonCanadaCaribbean small statesCayman IslandsCentral African RepublicCentral Europe and the BalticsChadChannel IslandsChileChinaColombiaComorosCongo, Dem. Rep.Congo, Rep.Costa RicaCote d'IvoireCroatiaCubaCuracaoCyprusCzech RepublicDenmarkDjiboutiDominicaDominican RepublicEarly-demographic dividendEast Asia & PacificEast Asia & Pacific (excluding high income)East Asia & Pacific (IDA & IBRD countries)EcuadorEgypt, Arab Rep.El SalvadorEquatorial GuineaEritreaEstoniaEthiopiaEuro areaEurope & Central AsiaEurope & Central Asia (excluding high income)Europe & Central Asia (IDA & IBRD countries)European UnionFaroe IslandsFijiFinlandFragile and conflict affected situationsFranceFrench PolynesiaGabonGambia, TheGeorgiaGermanyGhanaGibraltarGreeceGreenlandGrenadaGuamGuatemalaGuineaGuinea-BissauGuyanaHaitiHeavily indebted poor countries (HIPC)High incomeHondurasHong Kong SAR, ChinaHungaryIBRD onlyIcelandIDA & IBRD totalIDA blendIDA onlyIDA totalIndiaIndonesiaIran, Islamic Rep.IraqIrelandIsle of ManIsraelItalyJamaicaJapanJordanKazakhstanKenyaKiribatiKorea, Dem. People’s Rep.Korea, Rep.KuwaitKyrgyz RepublicLao PDRLate-demographic dividendLatin America & Caribbean Latin America & Caribbean (excluding high income)Latin America & the Caribbean (IDA & IBRD countries)LatviaLeast developed countries: UN classificationLebanonLesothoLiberiaLibyaLiechtensteinLithuaniaLow & middle incomeLow incomeLower middle incomeLuxembourgMacao SAR, ChinaMacedonia, FYRMadagascarMalawiMalaysiaMaldivesMaliMaltaMarshall IslandsMauritaniaMauritiusMexicoMicronesia, Fed. Sts.Middle East & North AfricaMiddle East & North Africa (excluding high income)Middle East & North Africa (IDA & IBRD countries)Middle incomeMoldovaMonacoMongoliaMontenegroMoroccoMozambiqueMyanmarNamibiaNauruNepalNetherlandsNew CaledoniaNew ZealandNicaraguaNigerNigeriaNorth AmericaNorthern Mariana IslandsNorwayOECD membersOmanOther small statesPacific island small statesPakistanPalauPanamaPapua New GuineaParaguayPeruPhilippinesPolandPortugalPost-demographic dividendPre-demographic dividendPuerto RicoQatarRomaniaRussian FederationRwandaSamoaSan MarinoSao Tome and PrincipeSaudi ArabiaSenegalSerbiaSeychellesSierra LeoneSingaporeSint Maarten (Dutch part)Slovak RepublicSloveniaSmall statesSolomon IslandsSomaliaSouth AfricaSouth AsiaSouth Asia (IDA & IBRD)South SudanSpainSri LankaSt. Kitts and NevisSt. LuciaSt. Vincent and the GrenadinesSub-Saharan Africa Sub-Saharan Africa (excluding high income)Sub-Saharan Africa (IDA & IBRD countries)SudanSurinameSwazilandSwedenSwitzerlandSyrian Arab RepublicTajikistanTanzaniaThailandTimor-LesteTogoTongaTrinidad and TobagoTunisiaTurkeyTurkmenistanTurks and Caicos IslandsTuvaluUgandaUkraineUnited Arab EmiratesUnited KingdomUnited StatesUpper middle incomeUruguayUzbekistanVanuatuVenezuela, RBVietnamVirgin Islands (U.S.)West Bank and GazaWorldYemen, Rep.ZambiaZimbabwe La ligne de temps
Cette échelle de temps montre un graphique de 1961 année à 2016 année Puerto Rico. Les données jusqu'à 1960 année ne sont pas présentés. Quantité d'observations actuelles selon dates: 56.
Source (désignation):
Les indicateurs du développement mondiale
Source (organisation):
World Bank Staff estimates based on United Nations, World Urbanization Prospects.
Catégories:
Agriculture & Rural Development
Dernière mise à jour
23 avr. 2017
Les indicateurs de changement de valeurs selon les années
Minimum:
5.613
1 janv. 2001
Maximum:
55.453
1 janv. 1961
Pour la date d''observation
Valeur
Changement absolu
Le changement par rapport à la valeur précédente
1 janv. 1961
55.453
+55.453
0.0%
1 janv. 1962
54.067
-1.386
-2.5%
1 janv. 1963
52.673
-1.394
-2.58%
1 janv. 1964
51.276
-1.397
-2.65%
1 janv. 1965
49.874
-1.402
-2.73%
1 janv. 1966
48.476
-1.398
-2.8%
1 janv. 1967
47.079
-1.397
-2.88%
1 janv. 1968
45.686
-1.393
-2.96%
1 janv. 1969
44.298
-1.388
-3.04%
1 janv. 1970
42.923
-1.375
-3.1%
1 janv. 1971
41.672
-1.251
-2.91%
1 janv. 1972
40.77
-0.902
-2.16%
1 janv. 1973
39.873
-0.897
-2.2%
1 janv. 1974
38.986
-0.887
-2.22%
1 janv. 1975
38.104
-0.882
-2.26%
1 janv. 1976
37.23
-0.874
-2.29%
1 janv. 1977
36.363
-0.867
-2.33%
1 janv. 1978
35.508
-0.855
-2.35%
1 janv. 1979
34.66
-0.848
-2.39%
1 janv. 1980
33.822
-0.838
-2.42%
1 janv. 1981
32.165
-1.657
-4.9%
1 janv. 1982
28.228
-3.937
-12.24%
1 janv. 1983
24.594
-3.634
-12.87%
1 janv. 1984
21.289
-3.305
-13.44%
1 janv. 1985
18.316
-2.973
-13.96%
1 janv. 1986
15.683
-2.633
-14.38%
1 janv. 1987
13.363
-2.32
-14.79%
1 janv. 1988
11.34
-2.023
-15.14%
1 janv. 1989
9.587
-1.753
-15.46%
1 janv. 1990
8.085
-1.502
-15.67%
1 janv. 1991
7.058
-1.027
-12.7%
1 janv. 1992
6.894
-0.164
-2.32%
1 janv. 1993
6.733
-0.161
-2.34%
1 janv. 1994
6.576
-0.157
-2.33%
1 janv. 1995
6.422
-0.154
-2.34%
1 janv. 1996
6.271
-0.151
-2.35%
1 janv. 1997
6.124
-0.147
-2.34%
1 janv. 1998
5.98
-0.144
-2.35%
1 janv. 1999
5.839
-0.141
-2.36%
1 janv. 2000
5.702
-0.137
-2.35%
1 janv. 2001
5.613
-0.089
-1.56%
1 janv. 2002
5.667
+0.054
0.96%
1 janv. 2003
5.722
+0.055
0.97%
1 janv. 2004
5.776
+0.054
0.94%
1 janv. 2005
5.832
+0.056
0.97%
1 janv. 2006
5.888
+0.056
0.96%
1 janv. 2007
5.944
+0.056
0.95%
1 janv. 2008
6.001
+0.057
0.96%
1 janv. 2009
6.058
+0.057
0.95%
1 janv. 2010
6.116
+0.058
0.96%
1 janv. 2011
6.175
+0.059
0.96%
1 janv. 2012
6.229
+0.054
0.87%
1 janv. 2013
6.278
+0.049
0.79%
1 janv. 2014
6.324
+0.046
0.73%
1 janv. 2015
6.364
+0.04
0.63%
1 janv. 2016
6.4
+0.036
0.57%
Classement des pays selon les statistiques actuelles par années


Commentaires: