29
/fr/
fr
AIzaSyAYiBZKx7MnpbEhh9jyipgxe19OcubqV5w
April 1, 2024
225934
Portugal
PRT
true
2
1
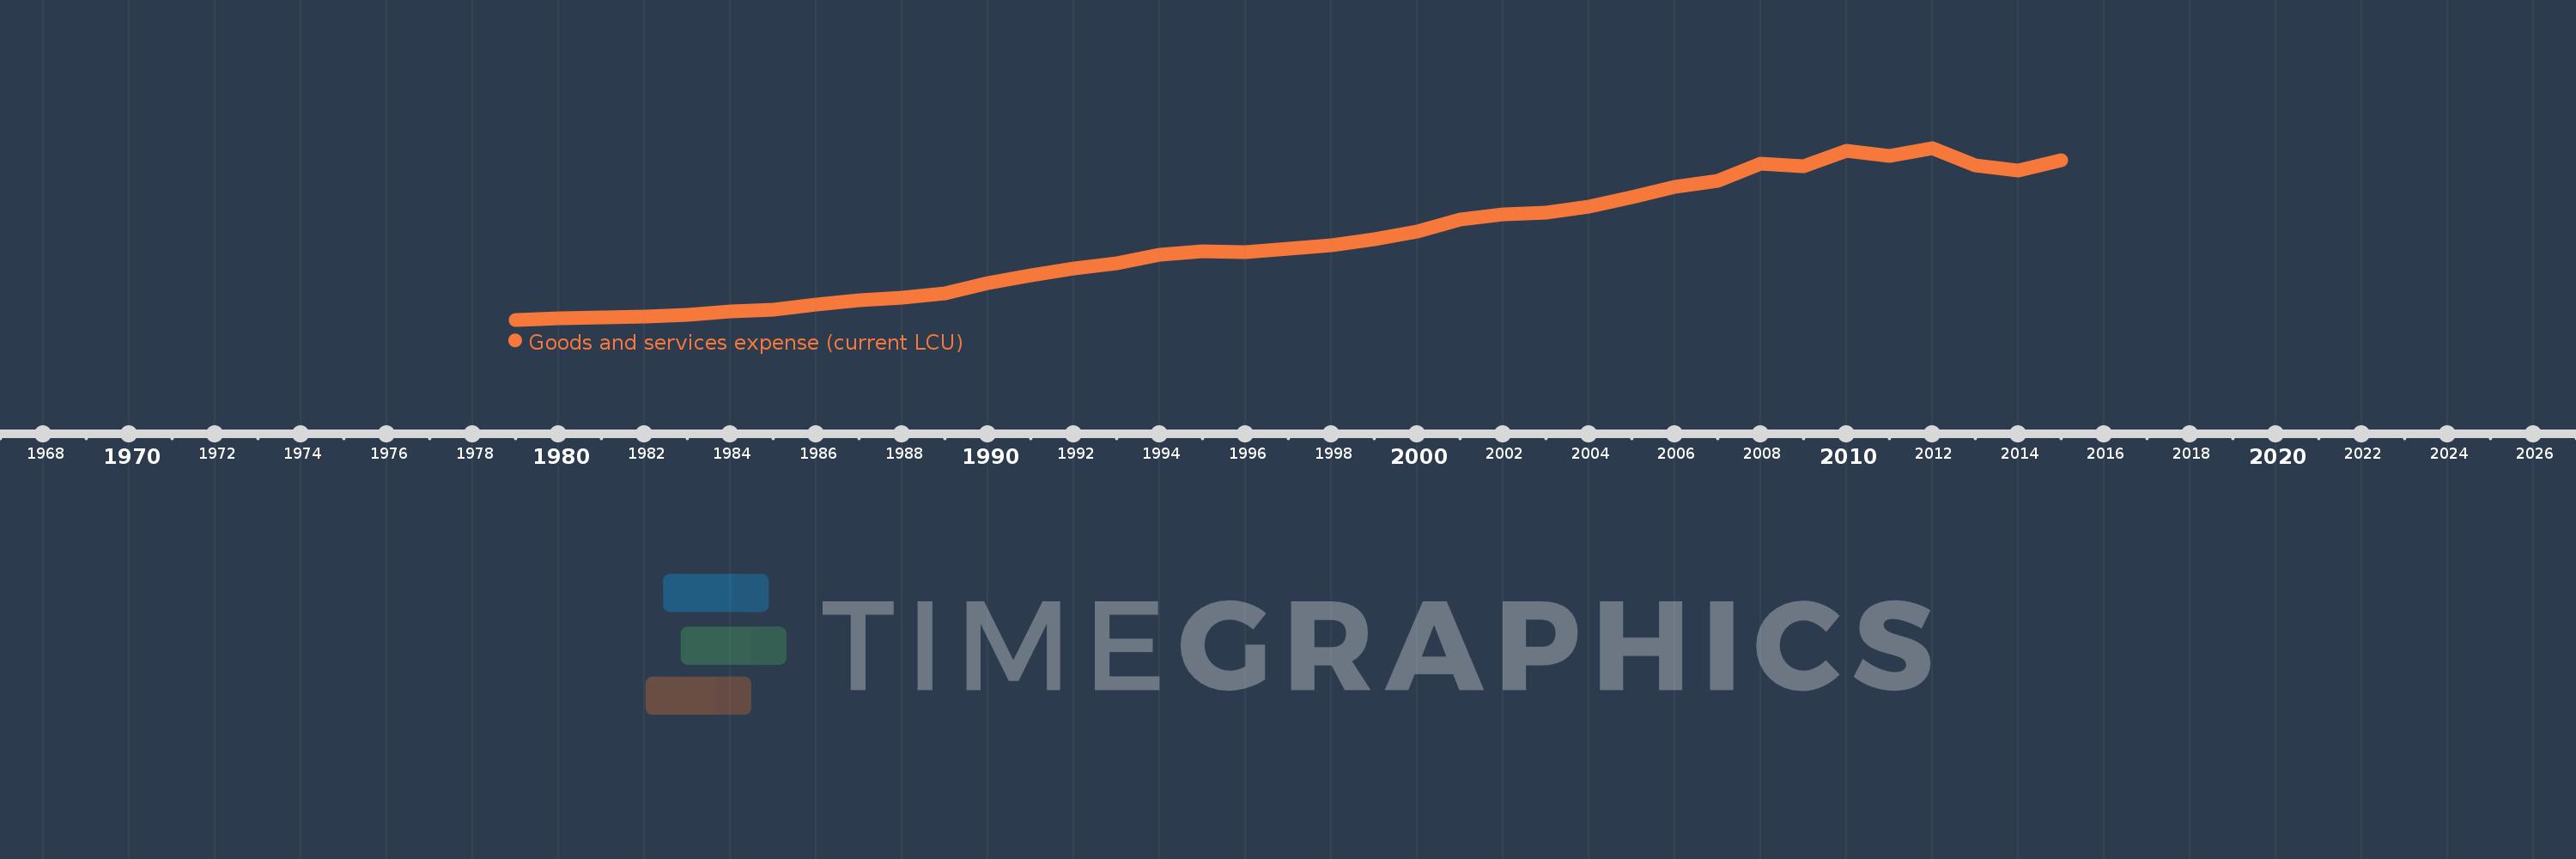
Goods and services expense (current LCU)
2015,2014,2013,2012,2011,2010,2009,2008,2007,2006,2005,2004,2003,2002,2001,2000,1999,1998,1997,1996,1995,1994,1993,1992,1991,1990,1989,1988,1987,1986,1985,1984,1983,1982,1981,1980,1979
Cette statistique dans les autres pays:
AfghanistanAlbaniaAlgeriaAngolaAntigua and BarbudaArmeniaAustraliaAustriaAzerbaijanBahamas, TheBahrainBangladeshBarbadosBelarusBelgiumBelizeBeninBhutanBoliviaBosnia and HerzegovinaBotswanaBrazilBulgariaBurkina FasoBurundiCabo VerdeCambodiaCanadaCentral African RepublicChileColombiaCongo, Dem. Rep.Congo, Rep.Costa RicaCote d'IvoireCroatiaCyprusCzech RepublicDenmarkDominicaDominican RepublicEgypt, Arab Rep.El SalvadorEquatorial GuineaEstoniaEthiopiaFijiFinlandFranceGambia, TheGeorgiaGermanyGhanaGreeceGrenadaGuatemalaHondurasHong Kong SAR, ChinaHungaryIcelandIndiaIndonesiaIran, Islamic Rep.IraqIrelandIsraelItalyJamaicaJapanJordanKazakhstanKenyaKiribatiKorea, Rep.KuwaitKyrgyz RepublicLao PDRLatviaLebanonLesothoLiberiaLithuaniaLuxembourgMacao SAR, ChinaMacedonia, FYRMadagascarMalawiMalaysiaMaldivesMaliMaltaMauritiusMexicoMicronesia, Fed. Sts.MoldovaMongoliaMoroccoMozambiqueNamibiaNepalNetherlandsNew ZealandNicaraguaNigeriaNorwayOmanPakistanPanamaPapua New GuineaParaguayPeruPhilippinesPolandPortugalQatarRomaniaRussian FederationRwandaSamoaSan MarinoSao Tome and PrincipeSenegalSerbiaSeychellesSierra LeoneSingaporeSlovak RepublicSloveniaSolomon IslandsSouth AfricaSpainSri LankaSt. Kitts and NevisSt. LuciaSurinameSwazilandSwedenSwitzerlandSyrian Arab RepublicTajikistanTanzaniaThailandTimor-LesteTogoTrinidad and TobagoTunisiaTurkeyUgandaUkraineUnited Arab EmiratesUnited KingdomUnited StatesUruguayVanuatuVenezuela, RBWest Bank and GazaYemen, Rep.ZambiaZimbabwe La ligne de temps
Cette échelle de temps montre un graphique de 1979 année à 2015 année Portugal. Les données jusqu'à 1978 année ne sont pas présentés. Quantité d'observations actuelles selon dates: 37.
Source (désignation):
Les indicateurs du développement mondiale
Source (organisation):
International Monetary Fund, Government Finance Statistics Yearbook and data files.
Catégories:
Public Sector
Dernière mise à jour
23 avr. 2017
Les indicateurs de changement de valeurs selon les années
Minimum:
120.709 mln.
1 janv. 1979
Maximum:
7.441 mds
1 janv. 2012
Pour la date d''observation
Valeur
Changement absolu
Le changement par rapport à la valeur précédente
1 janv. 1979
120.709 mln.
+120.709 mln.
0.0%
1 janv. 1980
178.071 mln.
+57.362 mln.
47.52%
1 janv. 1981
223.96 mln.
+45.889 mln.
25.77%
1 janv. 1982
268.852 mln.
+44.892 mln.
20.04%
1 janv. 1983
346.665 mln.
+77.812 mln.
28.94%
1 janv. 1984
471.364 mln.
+124.699 mln.
35.97%
1 janv. 1985
557.157 mln.
+85.793 mln.
18.2%
1 janv. 1986
753.684 mln.
+196.526 mln.
35.27%
1 janv. 1987
950.709 mln.
+197.025 mln.
26.14%
1 janv. 1988
1.05 mds
+99.061 mln.
10.42%
1 janv. 1989
1.248 mds
+198.462 mln.
18.91%
1 janv. 1990
1.673 mds
+425.235 mln.
34.07%
1 janv. 1991
1.999 mds
+325.216 mln.
19.43%
1 janv. 1992
2.318 mds
+319.231 mln.
15.97%
1 janv. 1993
2.523 mds
+205.006 mln.
8.84%
1 janv. 1994
2.89 mds
+367.115 mln.
14.55%
1 janv. 1995
3.053 mds
+162.608 mln.
5.63%
1 janv. 1996
2.994 mds
-58.793 mln.
-1.93%
1 janv. 1997
3.136 mds
+142.34 mln.
4.75%
1 janv. 1998
3.285 mds
+148.67 mln.
4.74%
1 janv. 1999
3.553 mds
+268.11 mln.
8.16%
1 janv. 2000
3.894 mds
+340.81 mln.
9.59%
1 janv. 2001
4.393 mds
+499.06 mln.
12.82%
1 janv. 2002
4.627 mds
+234.65 mln.
5.34%
1 janv. 2003
4.681 mds
+53.95 mln.
1.17%
1 janv. 2004
4.924 mds
+242.67 mln.
5.18%
1 janv. 2005
5.359 mds
+434.42 mln.
8.82%
1 janv. 2006
5.768 mds
+409.49 mln.
7.64%
1 janv. 2007
6.033 mds
+264.69 mln.
4.59%
1 janv. 2008
6.779 mds
+746.27 mln.
12.37%
1 janv. 2009
6.673 mds
-105.538 mln.
-1.56%
1 janv. 2010
7.329 mds
+655.11 mln.
9.82%
1 janv. 2011
7.101 mds
-227.557 mln.
-3.11%
1 janv. 2012
7.441 mds
+340.146 mln.
4.79%
1 janv. 2013
6.682 mds
-759.629 mln.
-10.21%
1 janv. 2014
6.473 mds
-208.201 mln.
-3.12%
1 janv. 2015
6.927 mds
+453.479 mln.
7.01%
Classement des pays selon les statistiques actuelles par années


Commentaires: