29
/fr/
fr
AIzaSyAYiBZKx7MnpbEhh9jyipgxe19OcubqV5w
April 1, 2024
223135
Philippines
PHL
true
2
1
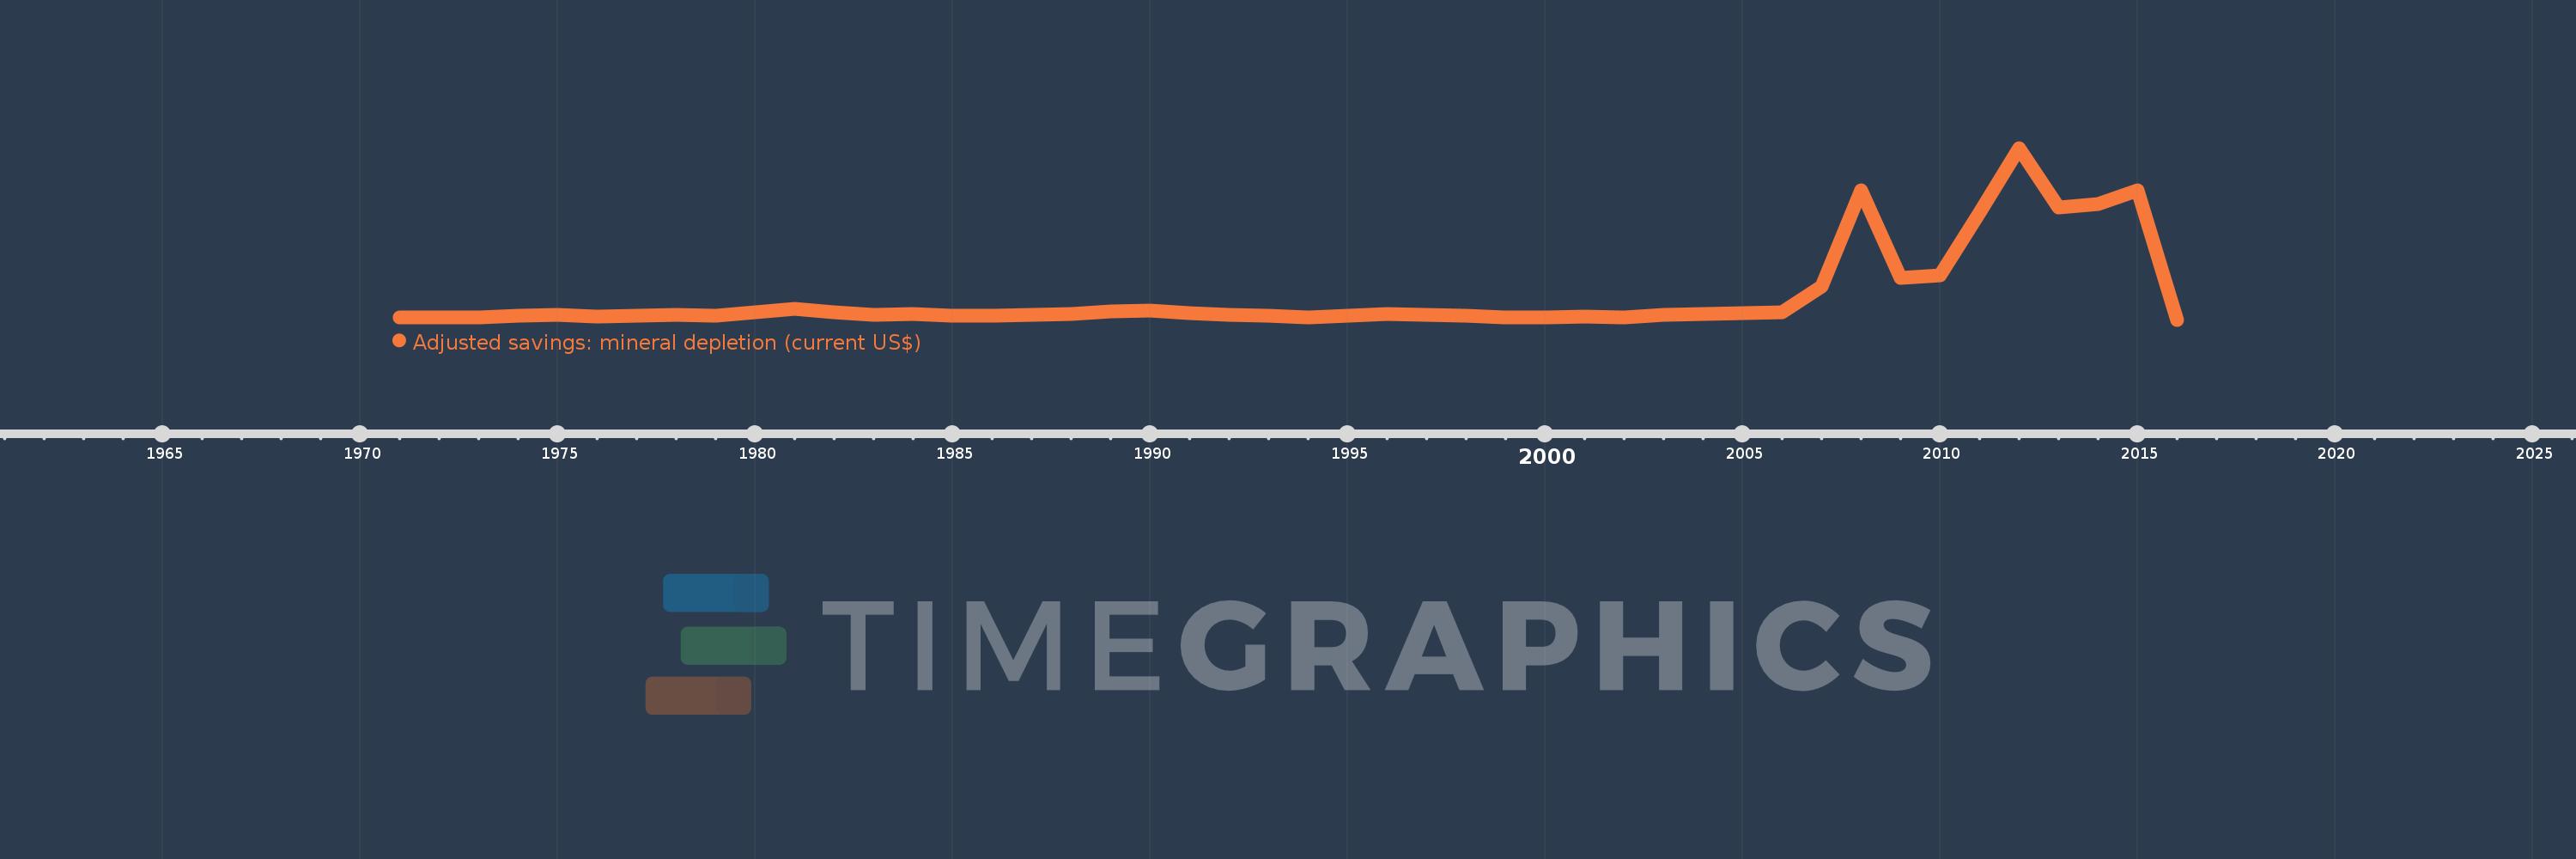
Adjusted savings: mineral depletion (current US$)
2016,2015,2014,2013,2012,2011,2010,2009,2008,2007,2006,2005,2004,2003,2002,2001,2000,1999,1998,1997,1996,1995,1994,1993,1992,1991,1990,1989,1988,1987,1986,1985,1984,1983,1982,1981,1980,1979,1978,1977,1976,1975,1974,1973,1972,1971
Cette statistique dans les autres pays:
AfghanistanAlbaniaAlgeriaAmerican SamoaAndorraAngolaAntigua and BarbudaArgentinaArmeniaArubaAustraliaAustriaAzerbaijanBahamas, TheBahrainBangladeshBarbadosBelarusBelgiumBelizeBeninBermudaBhutanBoliviaBosnia and HerzegovinaBotswanaBrazilBrunei DarussalamBulgariaBurkina FasoBurundiCabo VerdeCambodiaCameroonCanadaCayman IslandsCentral African RepublicChadChannel IslandsChileChinaColombiaComorosCongo, Dem. Rep.Congo, Rep.Costa RicaCote d'IvoireCroatiaCubaCuracaoCyprusCzech RepublicDenmarkDjiboutiDominicaDominican RepublicEcuadorEgypt, Arab Rep.El SalvadorEquatorial GuineaEritreaEstoniaEthiopiaFaroe IslandsFijiFinlandFranceFrench PolynesiaGabonGambia, TheGeorgiaGermanyGhanaGibraltarGreeceGreenlandGrenadaGuamGuatemalaGuineaGuinea-BissauGuyanaHaitiHondurasHong Kong SAR, ChinaHungaryIcelandIndiaIndonesiaIran, Islamic Rep.IraqIrelandIsle of ManIsraelItalyJamaicaJapanJordanKazakhstanKenyaKiribatiKorea, Dem. People’s Rep.Korea, Rep.KosovoKuwaitKyrgyz RepublicLao PDRLatviaLebanonLesothoLiberiaLibyaLiechtensteinLithuaniaLuxembourgMacao SAR, ChinaMacedonia, FYRMadagascarMalawiMalaysiaMaldivesMaliMaltaMarshall IslandsMauritaniaMauritiusMexicoMicronesia, Fed. Sts.MoldovaMonacoMongoliaMontenegroMoroccoMozambiqueMyanmarNamibiaNepalNetherlandsNew CaledoniaNew ZealandNicaraguaNigerNigeriaNorthern Mariana IslandsNorwayOmanPakistanPalauPanamaPapua New GuineaParaguayPeruPhilippinesPolandPortugalPuerto RicoQatarRomaniaRussian FederationRwandaSamoaSan MarinoSao Tome and PrincipeSaudi ArabiaSenegalSerbiaSeychellesSierra LeoneSingaporeSint Maarten (Dutch part)Slovak RepublicSloveniaSolomon IslandsSomaliaSouth AfricaSouth SudanSpainSri LankaSt. Kitts and NevisSt. LuciaSt. Martin (French part)St. Vincent and the GrenadinesSudanSurinameSwazilandSwedenSwitzerlandSyrian Arab RepublicTajikistanTanzaniaThailandTimor-LesteTogoTongaTrinidad and TobagoTunisiaTurkeyTurkmenistanTurks and Caicos IslandsTuvaluUgandaUkraineUnited Arab EmiratesUnited KingdomUnited StatesUruguayUzbekistanVanuatuVenezuela, RBVietnamVirgin Islands (U.S.)West Bank and GazaYemen, Rep.ZambiaZimbabwe La ligne de temps
Cette échelle de temps montre un graphique de 1971 année à 2016 année Philippines. Les données jusqu'à 1970 année ne sont pas présentés. Quantité d'observations actuelles selon dates: 46.
Source (désignation):
Les indicateurs du développement mondiale
Source (organisation):
World Bank staff estimates based on sources and methods in World Bank's "The Changing Wealth of Nations: Measuring Sustainable Development in the New Millennium" (2011).
Catégories:
Economy & Growth, Energy & Mining, Environment
Dernière mise à jour
23 avr. 2017
Les indicateurs de changement de valeurs selon les années
Maximum:
6.088 mds
1 janv. 2012
Pour la date d''observation
Valeur
Changement absolu
Le changement par rapport à la valeur précédente
1 janv. 1971
84.712 mln.
+84.712 mln.
0.0%
1 janv. 1972
74.001 mln.
-10.711 mln.
-12.64%
1 janv. 1973
75.263 mln.
+1.262 mln.
1.71%
1 janv. 1974
150.482 mln.
+75.219 mln.
99.94%
1 janv. 1975
186.844 mln.
+36.362 mln.
24.16%
1 janv. 1976
107.865 mln.
-78.979 mln.
-42.27%
1 janv. 1977
132.494 mln.
+24.629 mln.
22.83%
1 janv. 1978
165.462 mln.
+32.969 mln.
24.88%
1 janv. 1979
135.26 mln.
-30.202 mln.
-18.25%
1 janv. 1980
270.473 mln.
+135.213 mln.
99.96%
1 janv. 1981
394.612 mln.
+124.139 mln.
45.9%
1 janv. 1982
277.721 mln.
-116.891 mln.
-29.62%
1 janv. 1983
188.432 mln.
-89.289 mln.
-32.15%
1 janv. 1984
211.881 mln.
+23.45 mln.
12.44%
1 janv. 1985
151.86 mln.
-60.021 mln.
-28.33%
1 janv. 1986
155.787 mln.
+3.926 mln.
2.59%
1 janv. 1987
159.555 mln.
+3.768 mln.
2.42%
1 janv. 1988
213.134 mln.
+53.58 mln.
33.58%
1 janv. 1989
287.756 mln.
+74.622 mln.
35.01%
1 janv. 1990
337.218 mln.
+49.462 mln.
17.19%
1 janv. 1991
244.824 mln.
-92.394 mln.
-27.4%
1 janv. 1992
179.437 mln.
-65.387 mln.
-26.71%
1 janv. 1993
139.846 mln.
-39.591 mln.
-22.06%
1 janv. 1994
91.55 mln.
-48.297 mln.
-34.54%
1 janv. 1995
138.665 mln.
+47.115 mln.
51.46%
1 janv. 1996
214.065 mln.
+75.4 mln.
54.38%
1 janv. 1997
172.432 mln.
-41.634 mln.
-19.45%
1 janv. 1998
141.604 mln.
-30.828 mln.
-17.88%
1 janv. 1999
88.605 mln.
-52.999 mln.
-37.43%
1 janv. 2000
78.28 mln.
-10.325 mln.
-11.65%
1 janv. 2001
120.058 mln.
+41.778 mln.
53.37%
1 janv. 2002
80.361 mln.
-39.697 mln.
-33.07%
1 janv. 2003
179.532 mln.
+99.171 mln.
123.41%
1 janv. 2004
191.116 mln.
+11.584 mln.
6.45%
1 janv. 2005
227.627 mln.
+36.511 mln.
19.1%
1 janv. 2006
273.703 mln.
+46.076 mln.
20.24%
1 janv. 2007
1.169 mds
+895.741 mln.
327.27%
1 janv. 2008
4.579 mds
+3.409 mds
291.53%
1 janv. 2009
1.476 mds
-3.103 mds
-67.77%
1 janv. 2010
1.565 mds
+88.989 mln.
6.03%
1 janv. 2011
3.798 mds
+2.233 mds
142.71%
1 janv. 2012
6.088 mds
+2.29 mds
60.31%
1 janv. 2013
3.976 mds
-2.112 mds
-34.69%
1 janv. 2014
4.099 mds
+123.586 mln.
3.11%
1 janv. 2015
4.577 mds
+477.647 mln.
11.65%
1 janv. 2016
0.0
-4.577 mds
-100.0%
Classement des pays selon les statistiques actuelles par années


Commentaires: