29
/fr/
fr
AIzaSyAYiBZKx7MnpbEhh9jyipgxe19OcubqV5w
April 1, 2024
219714
Papua New Guinea
PNG
true
2
1
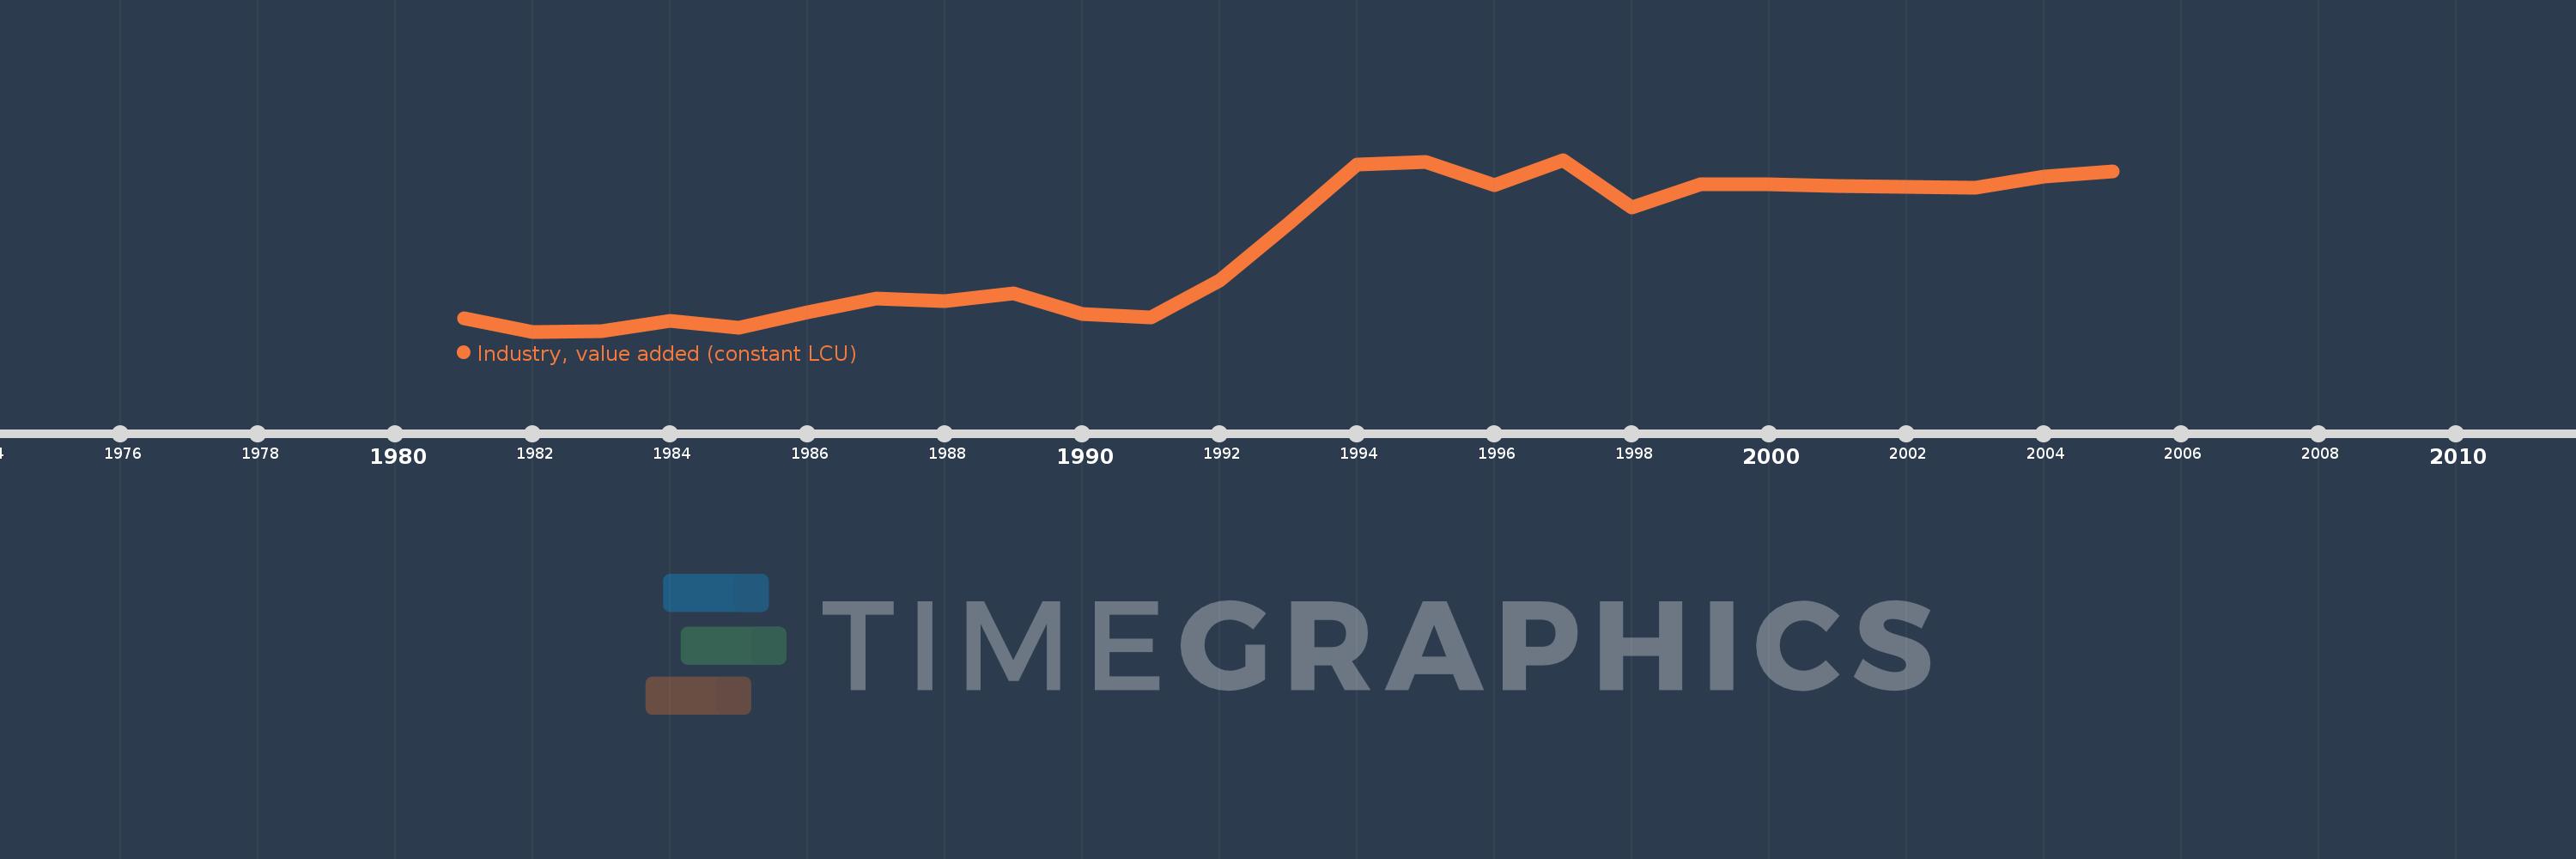
Industry, value added (constant LCU)
2005,2004,2003,2002,2001,2000,1999,1998,1997,1996,1995,1994,1993,1992,1991,1990,1989,1988,1987,1986,1985,1984,1983,1982,1981
Cette statistique dans les autres pays:
AfghanistanAlbaniaAlgeriaAntigua and BarbudaArgentinaArmeniaAustraliaAustriaAzerbaijanBahamas, TheBahrainBangladeshBelarusBelgiumBelizeBeninBermudaBhutanBoliviaBosnia and HerzegovinaBotswanaBrazilBrunei DarussalamBulgariaBurkina FasoBurundiCabo VerdeCambodiaCameroonCanadaCayman IslandsCentral African RepublicChadChileChinaColombiaComorosCongo, Dem. Rep.Congo, Rep.Costa RicaCote d'IvoireCroatiaCubaCyprusCzech RepublicDenmarkDjiboutiDominicaDominican RepublicEcuadorEgypt, Arab Rep.El SalvadorEquatorial GuineaEritreaEstoniaEthiopiaFijiFinlandFranceGabonGambia, TheGeorgiaGermanyGhanaGreeceGrenadaGuatemalaGuineaGuinea-BissauGuyanaHaitiHondurasHong Kong SAR, ChinaHungaryIcelandIndiaIndonesiaIran, Islamic Rep.IraqIrelandItalyJamaicaJapanJordanKazakhstanKenyaKiribatiKorea, Rep.KosovoKuwaitKyrgyz RepublicLao PDRLatviaLebanonLesothoLiberiaLithuaniaLuxembourgMacedonia, FYRMadagascarMalawiMalaysiaMaldivesMaliMarshall IslandsMauritaniaMauritiusMexicoMicronesia, Fed. Sts.MoldovaMongoliaMontenegroMoroccoMozambiqueMyanmarNamibiaNepalNetherlandsNew ZealandNicaraguaNigerNigeriaNorwayOmanPakistanPalauPanamaPapua New GuineaParaguayPeruPhilippinesPolandPortugalPuerto RicoQatarRomaniaRussian FederationRwandaSamoaSao Tome and PrincipeSaudi ArabiaSenegalSerbiaSeychellesSierra LeoneSingaporeSlovak RepublicSloveniaSolomon IslandsSomaliaSouth AfricaSpainSri LankaSt. Kitts and NevisSt. LuciaSt. Vincent and the GrenadinesSudanSurinameSwazilandSwedenSwitzerlandSyrian Arab RepublicTajikistanTanzaniaThailandTimor-LesteTogoTongaTrinidad and TobagoTunisiaTurkeyTurkmenistanTuvaluUgandaUkraineUnited Arab EmiratesUnited KingdomUnited StatesUruguayUzbekistanVanuatuVenezuela, RBVietnamWest Bank and GazaZambiaZimbabwe La ligne de temps
Cette échelle de temps montre un graphique de 1981 année à 2005 année Papua New Guinea. Les données jusqu'à 1980 année ne sont pas présentés. Quantité d'observations actuelles selon dates: 25.
Source (désignation):
Les indicateurs du développement mondiale
Source (organisation):
World Bank national accounts data, and OECD National Accounts data files.
Catégories:
Economy & Growth
Dernière mise à jour
23 avr. 2017
Les indicateurs de changement de valeurs selon les années
Minimum:
1.029 mds
1 janv. 1982
Maximum:
2.687 mds
1 janv. 1997
Pour la date d''observation
Valeur
Changement absolu
Le changement par rapport à la valeur précédente
1 janv. 1981
1.16 mds
+1.16 mds
0.0%
1 janv. 1982
1.029 mds
-131.813 mln.
-11.36%
1 janv. 1983
1.037 mds
+8.155 mln.
0.79%
1 janv. 1984
1.133 mds
+96.537 mln.
9.31%
1 janv. 1985
1.064 mds
-69.416 mln.
-6.13%
1 janv. 1986
1.212 mds
+148.504 mln.
13.96%
1 janv. 1987
1.345 mds
+133.141 mln.
10.98%
1 janv. 1988
1.322 mds
-23.139 mln.
-1.72%
1 janv. 1989
1.395 mds
+72.45 mln.
5.48%
1 janv. 1990
1.198 mds
-196.488 mln.
-14.09%
1 janv. 1991
1.168 mds
-29.777 mln.
-2.48%
1 janv. 1992
1.519 mds
+350.111 mln.
29.96%
1 janv. 1993
2.068 mds
+549.065 mln.
36.16%
1 janv. 1994
2.643 mds
+575.238 mln.
27.82%
1 janv. 1995
2.67 mds
+27.501 mln.
1.04%
1 janv. 1996
2.441 mds
-229.488 mln.
-8.59%
1 janv. 1997
2.687 mds
+246.368 mln.
10.09%
1 janv. 1998
2.23 mds
-457.649 mln.
-17.03%
1 janv. 1999
2.447 mds
+217.16 mln.
9.74%
1 janv. 2000
2.452 mds
+5.5 mln.
0.22%
1 janv. 2001
2.431 mds
-21.6 mln.
-0.88%
1 janv. 2002
2.423 mds
-7.3 mln.
-0.3%
1 janv. 2003
2.414 mds
-9.2 mln.
-0.38%
1 janv. 2004
2.526 mds
+111.7 mln.
4.63%
1 janv. 2005
2.574 mds
+48.0 mln.
1.9%
Classement des pays selon les statistiques actuelles par années


Commentaires: