29
/fr/
fr
AIzaSyAYiBZKx7MnpbEhh9jyipgxe19OcubqV5w
April 1, 2024
219348
Papua New Guinea
PNG
true
2
1
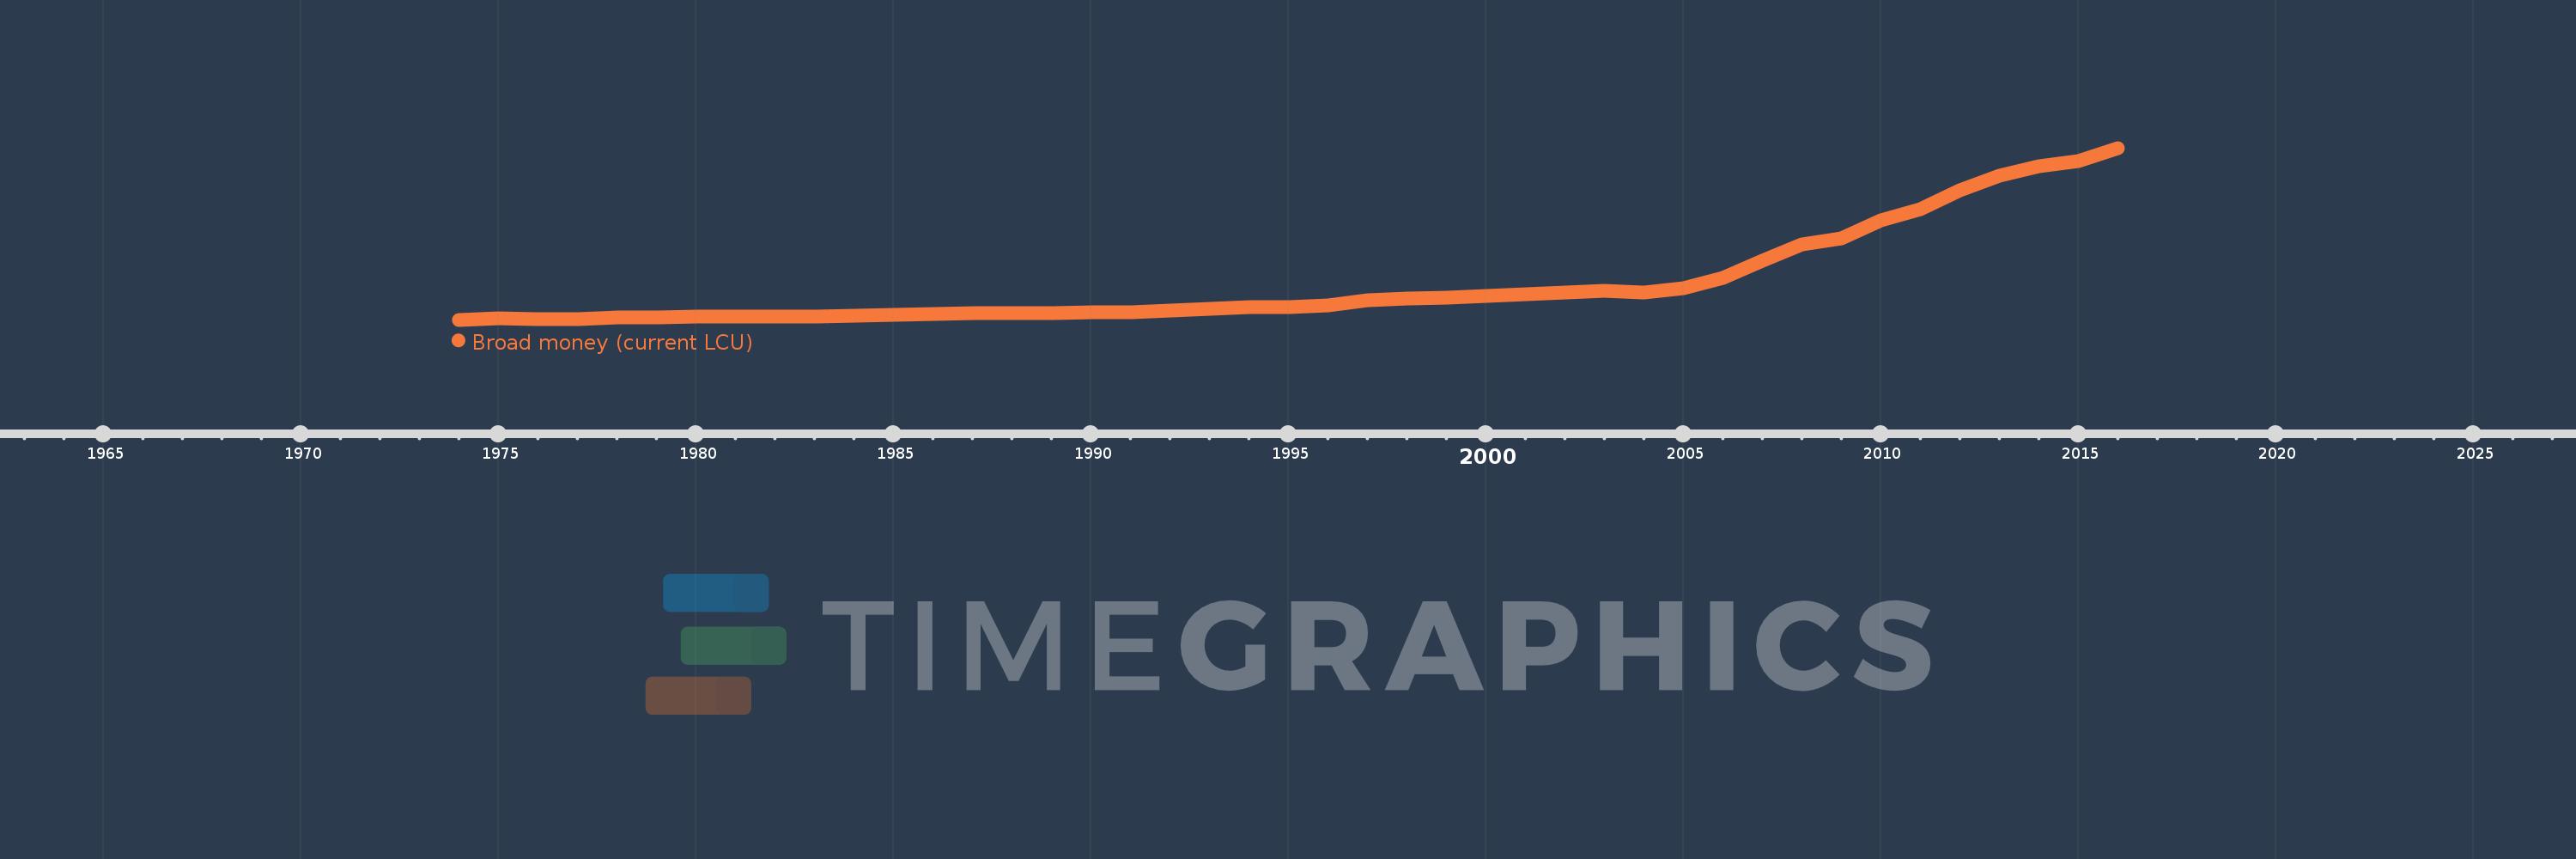
Broad money (current LCU)
2016,2015,2014,2013,2012,2011,2010,2009,2008,2007,2006,2005,2004,2003,2002,2001,2000,1999,1998,1997,1996,1995,1994,1993,1992,1991,1990,1989,1988,1987,1986,1985,1984,1983,1982,1981,1980,1979,1978,1977,1976,1975,1974
Cette statistique dans les autres pays:
AfghanistanAlbaniaAlgeriaAngolaAntigua and BarbudaArgentinaArmeniaArubaAustraliaAzerbaijanBahamas, TheBahrainBangladeshBarbadosBelarusBelizeBeninBhutanBoliviaBosnia and HerzegovinaBotswanaBrazilBrunei DarussalamBulgariaBurkina FasoBurundiCabo VerdeCambodiaCameroonCanadaCentral African RepublicChadChileChinaColombiaComorosCongo, Dem. Rep.Congo, Rep.Costa RicaCote d'IvoireCroatiaCzech RepublicDenmarkDjiboutiDominicaDominican RepublicEcuadorEgypt, Arab Rep.El SalvadorEquatorial GuineaEritreaEstoniaEthiopiaEuro areaFijiGabonGambia, TheGeorgiaGhanaGrenadaGuatemalaGuineaGuinea-BissauGuyanaHaitiHondurasHong Kong SAR, ChinaHungaryIcelandIndiaIndonesiaIran, Islamic Rep.IraqIsraelJamaicaJapanJordanKazakhstanKenyaKorea, Rep.KuwaitKyrgyz RepublicLao PDRLatviaLebanonLesothoLiberiaLibyaLithuaniaMacao SAR, ChinaMacedonia, FYRMadagascarMalawiMalaysiaMaldivesMaliMauritaniaMauritiusMexicoMicronesia, Fed. Sts.MoldovaMongoliaMoroccoMozambiqueMyanmarNamibiaNepalNew ZealandNicaraguaNigerNigeriaNorwayOmanPakistanPanamaPapua New GuineaParaguayPeruPhilippinesPolandQatarRomaniaRussian FederationRwandaSamoaSao Tome and PrincipeSaudi ArabiaSenegalSerbiaSeychellesSierra LeoneSingaporeSlovak RepublicSolomon IslandsSouth AfricaSouth SudanSri LankaSt. Kitts and NevisSt. LuciaSt. Vincent and the GrenadinesSudanSurinameSwazilandSwedenSwitzerlandSyrian Arab RepublicTajikistanTanzaniaThailandTimor-LesteTogoTongaTrinidad and TobagoTunisiaTurkeyUgandaUkraineUnited Arab EmiratesUnited KingdomUnited StatesUruguayVanuatuVenezuela, RBVietnamWest Bank and GazaYemen, Rep.ZambiaZimbabwe La ligne de temps
Cette échelle de temps montre un graphique de 1974 année à 2016 année Papua New Guinea. Les données jusqu'à 1973 année ne sont pas présentés. Quantité d'observations actuelles selon dates: 43.
Source (désignation):
Les indicateurs du développement mondiale
Source (organisation):
International Monetary Fund, International Financial Statistics and data files.
Catégories:
Financial Sector
Dernière mise à jour
23 avr. 2017
Les indicateurs de changement de valeurs selon les années
Minimum:
195.64 mln.
1 janv. 1974
Maximum:
20.219 mds
1 janv. 2016
Pour la date d''observation
Valeur
Changement absolu
Le changement par rapport à la valeur précédente
1 janv. 1974
195.64 mln.
+195.64 mln.
0.0%
1 janv. 1975
320.039 mln.
+124.399 mln.
63.59%
1 janv. 1976
245.462 mln.
-74.577 mln.
-23.3%
1 janv. 1977
277.817 mln.
+32.355 mln.
13.18%
1 janv. 1978
428.457 mln.
+150.64 mln.
54.22%
1 janv. 1979
449.032 mln.
+20.575 mln.
4.8%
1 janv. 1980
571.71 mln.
+122.678 mln.
27.32%
1 janv. 1981
553.146 mln.
-18.564 mln.
-3.25%
1 janv. 1982
554.735 mln.
+1.589 mln.
0.29%
1 janv. 1983
567.853 mln.
+13.118 mln.
2.36%
1 janv. 1984
650.044 mln.
+82.191 mln.
14.47%
1 janv. 1985
748.02 mln.
+97.976 mln.
15.07%
1 janv. 1986
820.121 mln.
+72.101 mln.
9.64%
1 janv. 1987
928.96 mln.
+108.839 mln.
13.27%
1 janv. 1988
943.293 mln.
+14.333 mln.
1.54%
1 janv. 1989
984.85 mln.
+41.557 mln.
4.41%
1 janv. 1990
1.038 mds
+52.651 mln.
5.35%
1 janv. 1991
1.082 mds
+44.105 mln.
4.25%
1 janv. 1992
1.272 mds
+190.854 mln.
17.65%
1 janv. 1993
1.432 mds
+159.244 mln.
12.51%
1 janv. 1994
1.686 mds
+254.759 mln.
17.79%
1 janv. 1995
1.665 mds
-21.629 mln.
-1.28%
1 janv. 1996
1.894 mds
+228.854 mln.
13.75%
1 janv. 1997
2.476 mds
+582.111 mln.
30.74%
1 janv. 1998
2.666 mds
+190.487 mln.
7.69%
1 janv. 1999
2.732 mds
+65.623 mln.
2.46%
1 janv. 2000
2.982 mds
+250.464 mln.
9.17%
1 janv. 2001
3.132 mds
+149.386 mln.
5.01%
1 janv. 2002
3.327 mds
+195.719 mln.
6.25%
1 janv. 2003
3.569 mds
+241.716 mln.
7.26%
1 janv. 2004
3.41 mds
-158.695 mln.
-4.45%
1 janv. 2005
3.915 mds
+504.305 mln.
14.79%
1 janv. 2006
5.069 mds
+1.154 mds
29.49%
1 janv. 2007
7.04 mds
+1.971 mds
38.88%
1 janv. 2008
8.995 mds
+1.955 mds
27.76%
1 janv. 2009
9.7 mds
+705.485 mln.
7.84%
1 janv. 2010
11.823 mds
+2.122 mds
21.88%
1 janv. 2011
13.034 mds
+1.211 mds
10.25%
1 janv. 2012
15.293 mds
+2.259 mds
17.34%
1 janv. 2013
16.967 mds
+1.673 mds
10.94%
1 janv. 2014
18.104 mds
+1.137 mds
6.7%
1 janv. 2015
18.716 mds
+612.415 mln.
3.38%
1 janv. 2016
20.219 mds
+1.502 mds
8.03%
Classement des pays selon les statistiques actuelles par années


Commentaires: