29
/fr/
fr
AIzaSyAYiBZKx7MnpbEhh9jyipgxe19OcubqV5w
April 1, 2024
219209
Panama
PAN
true
2
1
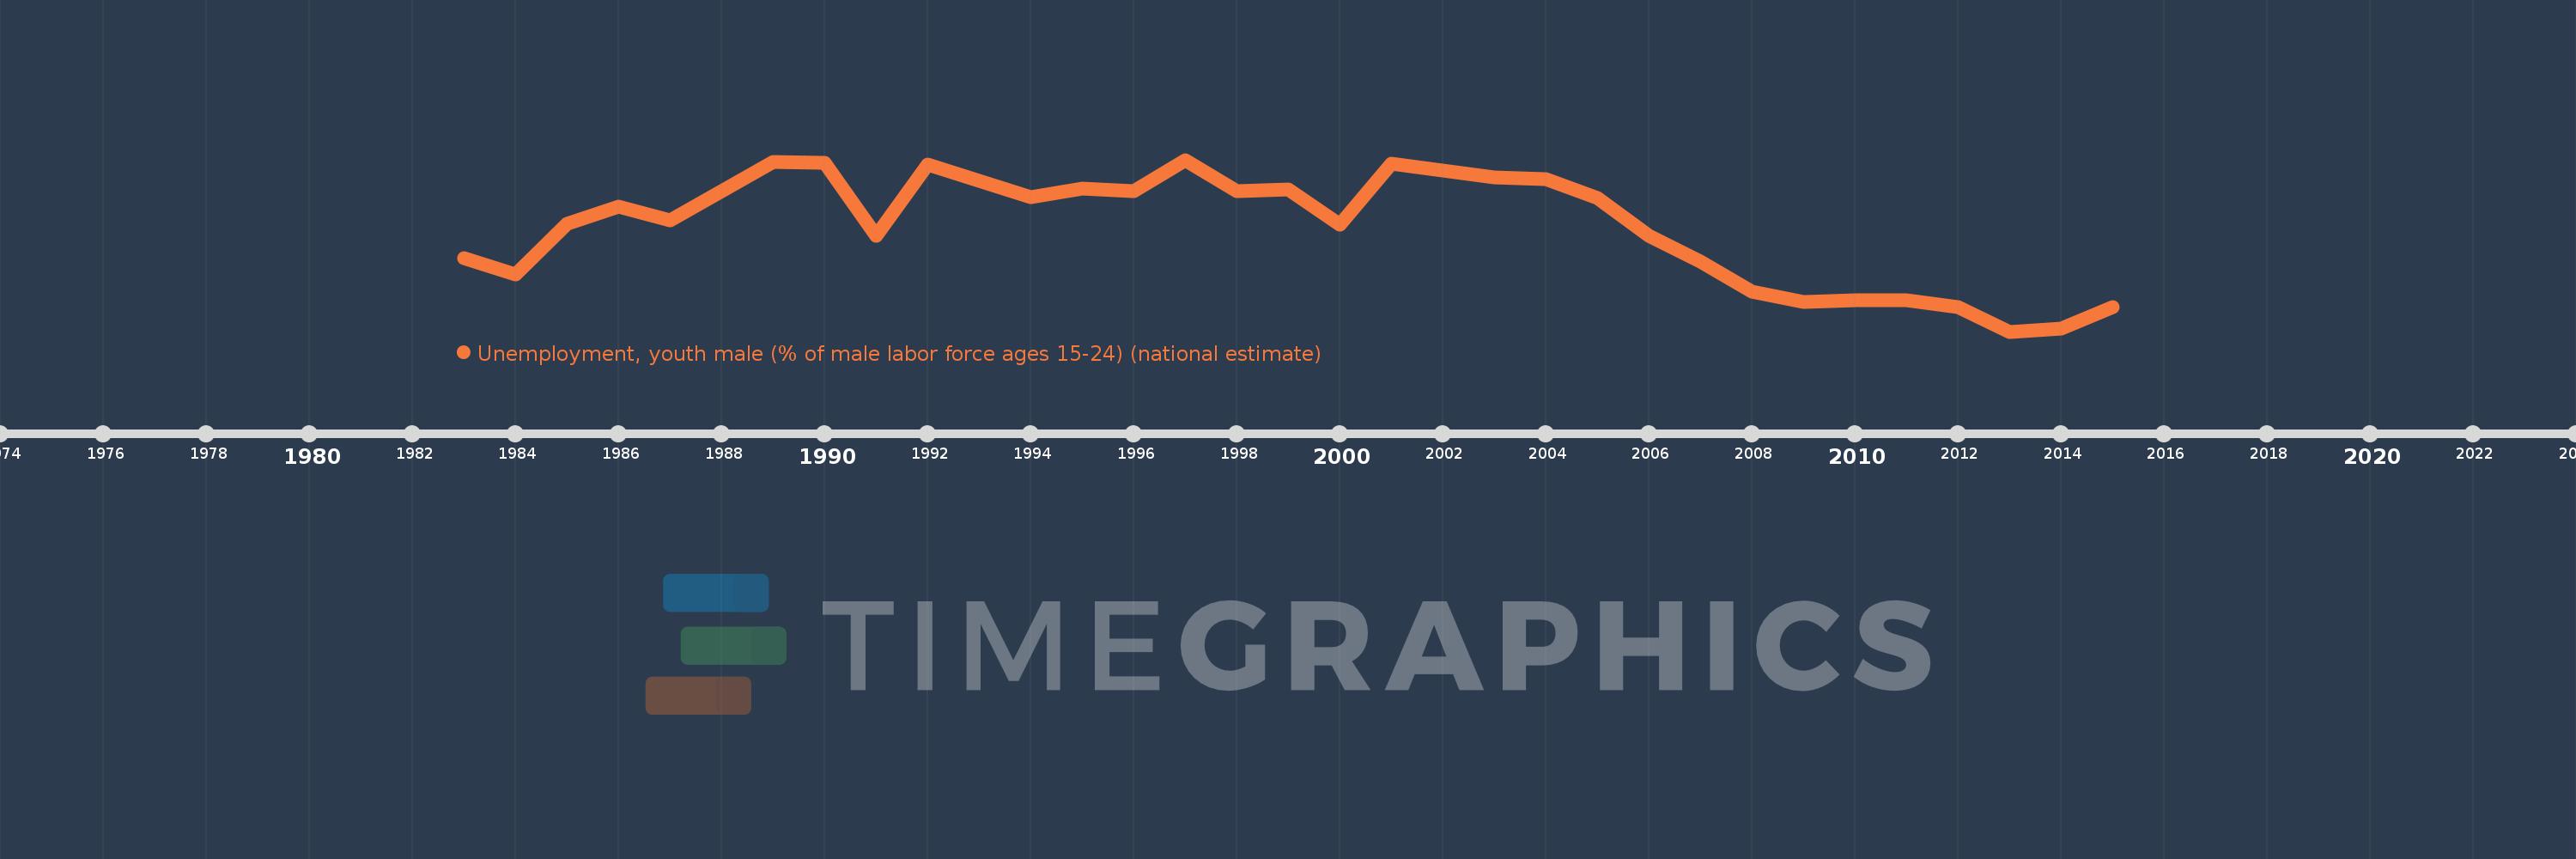
Unemployment, youth male (% of male labor force ages 15-24) (national estimate)
2015,2014,2013,2012,2011,2010,2009,2008,2007,2006,2005,2004,2003,2001,2000,1999,1998,1997,1996,1995,1994,1992,1991,1990,1989,1987,1986,1985,1984,1983
Cette statistique dans les autres pays:
AlbaniaAlgeriaAmerican SamoaAntigua and BarbudaArab WorldArgentinaArmeniaArubaAustraliaAustriaAzerbaijanBahamas, TheBahrainBangladeshBarbadosBelarusBelgiumBelizeBeninBermudaBhutanBoliviaBosnia and HerzegovinaBotswanaBrazilBritish Virgin IslandsBulgariaBurkina FasoBurundiCabo VerdeCambodiaCameroonCanadaCaribbean small statesCayman IslandsCentral Europe and the BalticsChileColombiaCosta RicaCroatiaCubaCyprusCzech RepublicDenmarkDominicaDominican RepublicEarly-demographic dividendEcuadorEgypt, Arab Rep.El SalvadorEstoniaEthiopiaEuro areaEurope & Central AsiaEurope & Central Asia (excluding high income)Europe & Central Asia (IDA & IBRD countries)European UnionFaroe IslandsFijiFinlandFranceFrench PolynesiaGabonGambia, TheGeorgiaGermanyGhanaGreeceGrenadaGuamGuatemalaGuineaGuyanaHaitiHigh incomeHondurasHong Kong SAR, ChinaHungaryIcelandIndiaIndonesiaIran, Islamic Rep.IrelandIsle of ManIsraelItalyJamaicaJapanJordanKazakhstanKiribatiKorea, Rep.KosovoKuwaitKyrgyz RepublicLao PDRLatin America & Caribbean Latin America & Caribbean (excluding high income)Latin America & the Caribbean (IDA & IBRD countries)LatviaLebanonLesothoLiberiaLibyaLithuaniaLower middle incomeLuxembourgMacao SAR, ChinaMacedonia, FYRMadagascarMalawiMalaysiaMaldivesMaliMaltaMarshall IslandsMauritiusMexicoMiddle East & North AfricaMiddle East & North Africa (excluding high income)Middle East & North Africa (IDA & IBRD countries)MoldovaMonacoMongoliaMontenegroMoroccoMozambiqueNamibiaNauruNepalNetherlandsNew ZealandNicaraguaNigerNigeriaNorth AmericaNorthern Mariana IslandsNorwayOECD membersPakistanPalauPanamaParaguayPeruPhilippinesPolandPortugalPost-demographic dividendPuerto RicoQatarRomaniaRussian FederationRwandaSamoaSan MarinoSao Tome and PrincipeSaudi ArabiaSenegalSerbiaSeychellesSierra LeoneSingaporeSlovak RepublicSloveniaSolomon IslandsSouth AfricaSouth AsiaSouth Asia (IDA & IBRD)South SudanSpainSri LankaSt. Kitts and NevisSt. LuciaSt. Vincent and the GrenadinesSudanSurinameSwazilandSwedenSwitzerlandSyrian Arab RepublicTajikistanTanzaniaThailandTimor-LesteTongaTrinidad and TobagoTunisiaTurkeyUgandaUkraineUnited Arab EmiratesUnited KingdomUnited StatesUruguayVanuatuVenezuela, RBVietnamWest Bank and GazaYemen, Rep.ZambiaZimbabwe La ligne de temps
Cette échelle de temps montre un graphique de 1983 année à 2015 année Panama. Les données jusqu'à 1982 année ne sont pas présentés. Quantité d'observations actuelles selon dates: 30.
Source (désignation):
Les indicateurs du développement mondiale
Source (organisation):
International Labour Organization, Key Indicators of the Labour Market database.
Catégories:
Social Protection & Labor
Dernière mise à jour
23 avr. 2017
Les indicateurs de changement de valeurs selon les années
Pour la date d''observation
Valeur
Changement absolu
Le changement par rapport à la valeur précédente
1 janv. 1983
16.2
+16.2
0.0%
1 janv. 1984
14.5
-1.7
-10.49%
1 janv. 1985
19.7
+5.2
35.86%
1 janv. 1986
21.4
+1.7
8.63%
1 janv. 1987
20.0
-1.4
-6.54%
1 janv. 1989
26.0
+6.0
30.0%
1 janv. 1990
25.9
-0.1
-0.38%
1 janv. 1991
18.5
-7.4
-28.57%
1 janv. 1992
25.7
+7.2
38.92%
1 janv. 1994
22.4
-3.3
-12.84%
1 janv. 1995
23.3
+0.9
4.02%
1 janv. 1996
23.0
-0.3
-1.29%
1 janv. 1997
26.2
+3.2
13.91%
1 janv. 1998
23.0
-3.2
-12.21%
1 janv. 1999
23.2
+0.2
0.87%
1 janv. 2000
19.6
-3.6
-15.52%
1 janv. 2001
25.8
+6.2
31.63%
1 janv. 2003
24.4
-1.4
-5.43%
1 janv. 2004
24.2
-0.2
-0.82%
1 janv. 2005
22.3
-1.9
-7.85%
1 janv. 2006
18.5
-3.8
-17.04%
1 janv. 2007
15.8
-2.7
-14.59%
1 janv. 2008
12.8
-3.0
-18.99%
1 janv. 2009
11.7
-1.1
-8.59%
1 janv. 2010
11.9
+0.2
1.71%
1 janv. 2011
11.9
0.0
0.0%
1 janv. 2012
11.2
-0.7
-5.88%
1 janv. 2013
8.7
-2.5
-22.32%
1 janv. 2014
9.0
+0.3
3.45%
1 janv. 2015
11.2
+2.2
24.44%
Classement des pays selon les statistiques actuelles par années


Commentaires: