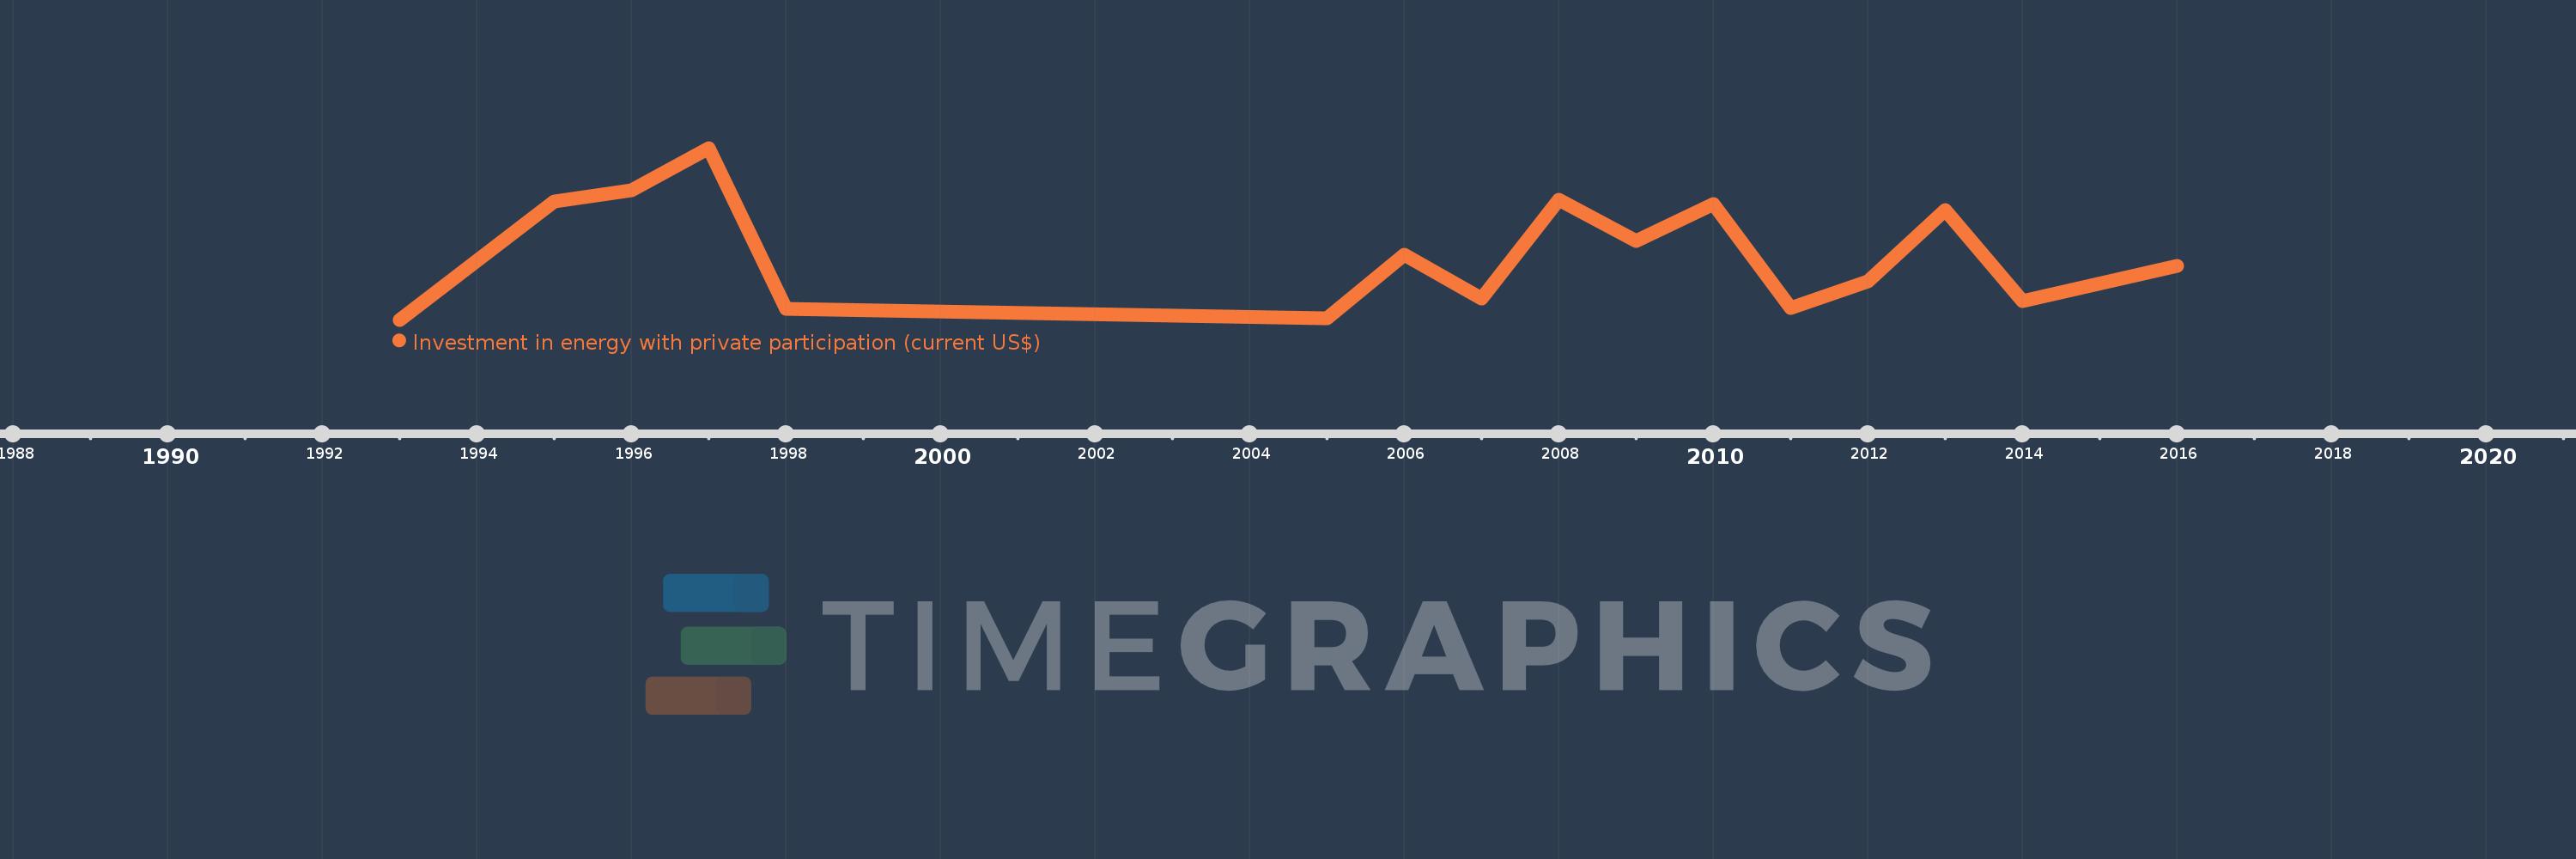
Cette échelle de temps montre un graphique de 1993 année à 2016 année Pakistan. Les données jusqu'à 1992 année ne sont pas présentés. Quantité d'observations actuelles selon dates: 16.
Source (désignation):
Les indicateurs du développement mondiale
Source (organisation):
World Bank, Private Participation in Infrastructure Project Database (http://ppi.worldbank.org).
Catégories:
Energy & Mining, Infrastructure, Private Sector
Dernière mise à jour
23 avr. 2017
Les indicateurs de changement de valeurs selon les années
En moyenne:
920.544 mln.
Minimum:
6.7 mln.
1 janv. 1993
Maximum:
2.366 mds
1 janv. 1997
Pour la date d''observation
Valeur
Changement absolu
Le changement par rapport à la valeur précédente
1 janv. 1993
6.7 mln.
+6.7 mln.
0.0%
1 janv. 1995
1.632 mds
+1.625 mds
24.26 milles%
1 janv. 1996
1.779 mds
+146.6 mln.
8.98%
1 janv. 1997
2.366 mds
+587.1 mln.
33.01%
1 janv. 1998
154.0 mln.
-2.212 mds
-93.49%
1 janv. 2005
29.8 mln.
-124.2 mln.
-80.65%
1 janv. 2006
904.6 mln.
+874.8 mln.
2.94 milles%
1 janv. 2007
297.6 mln.
-607.0 mln.
-67.1%
1 janv. 2008
1.655 mds
+1.357 mds
456.01%
1 janv. 2009
1.084 mds
-570.3 mln.
-34.47%
1 janv. 2010
1.593 mds
+508.4 mln.
46.88%
1 janv. 2011
166.0 mln.
-1.427 mds
-89.58%
1 janv. 2012
538.3 mln.
+372.3 mln.
224.28%
1 janv. 2013
1.51 mds
+972.2 mln.
180.61%
1 janv. 2014
263.1 mln.
-1.247 mds
-82.58%
1 janv. 2016
749.9 mln.
+486.8 mln.
185.02%
Classement des pays selon les statistiques actuelles par années
