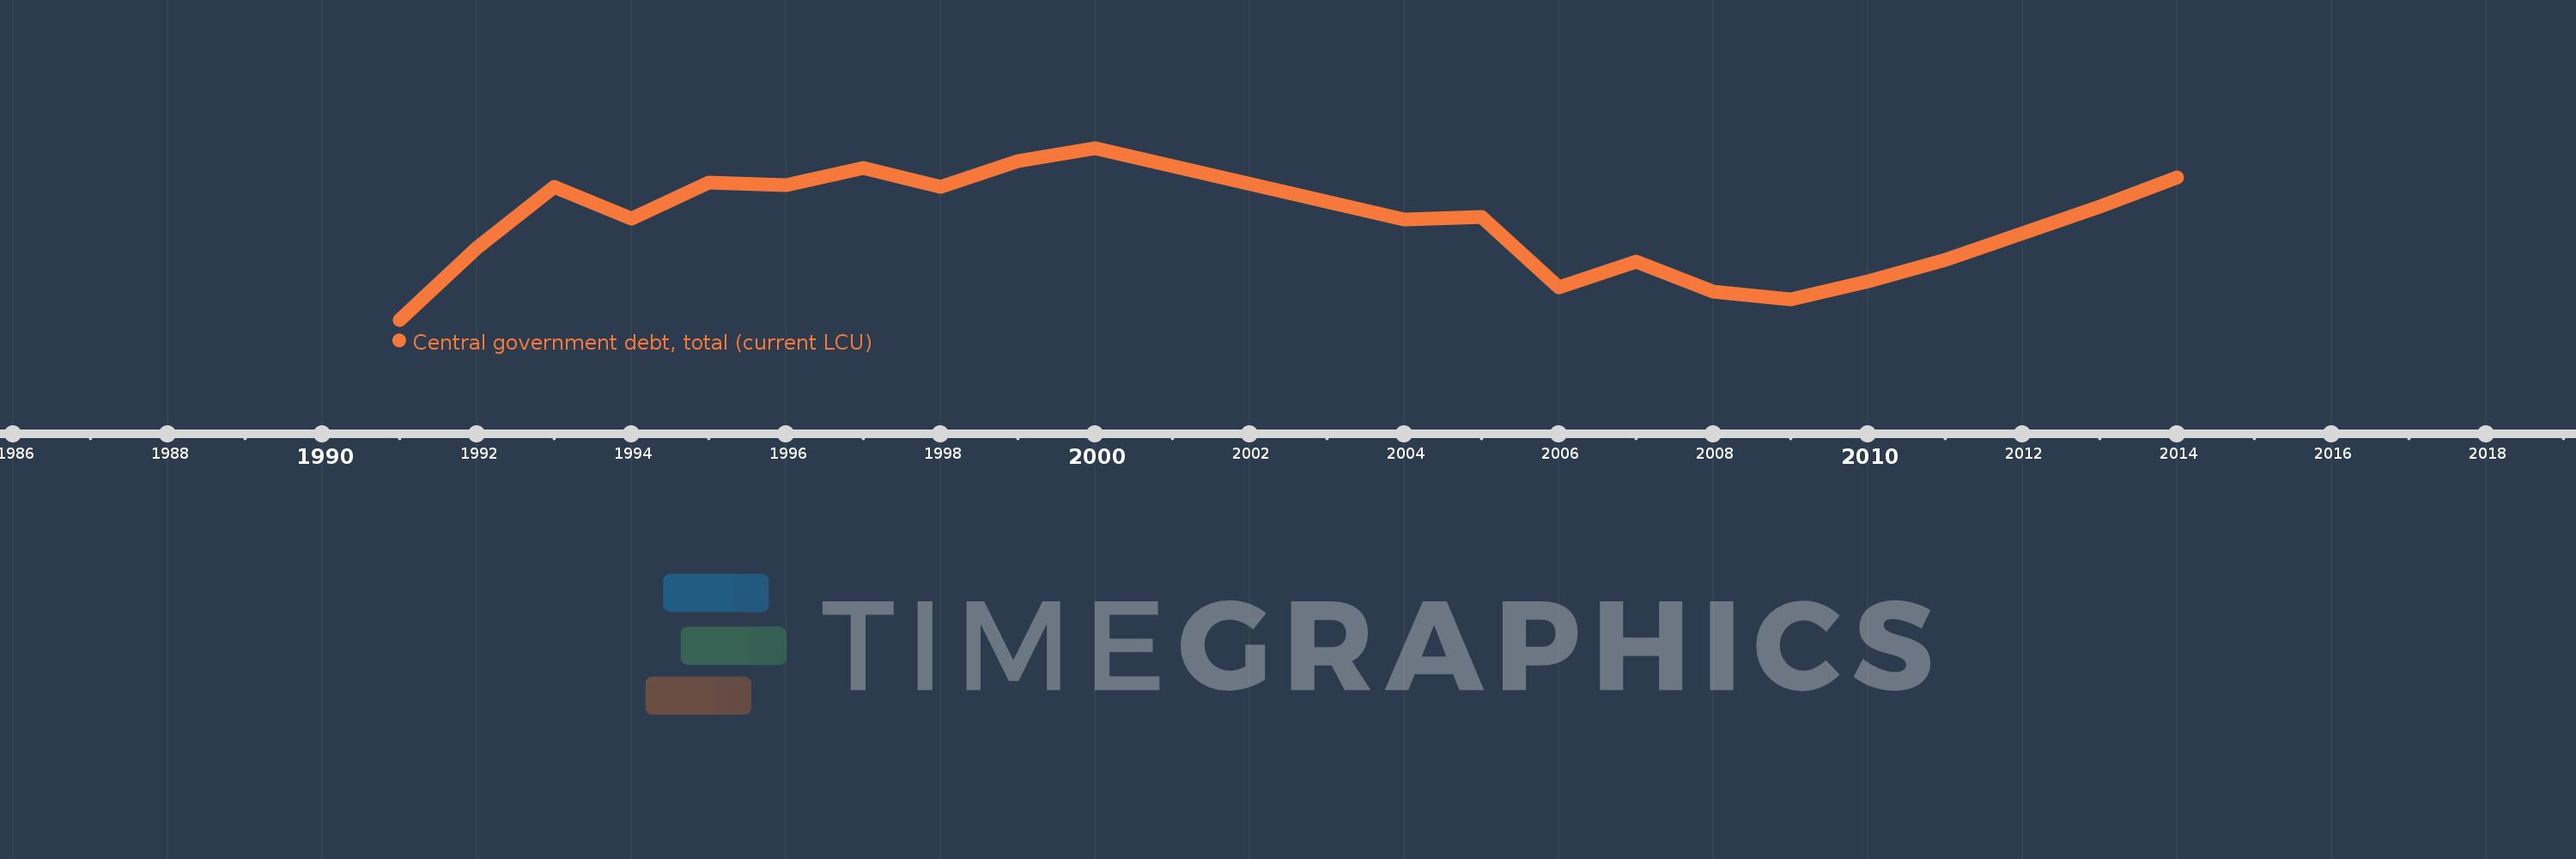
Cette échelle de temps montre un graphique de 1991 année à 2014 année Oman. Les données jusqu'à 1990 année ne sont pas présentés. Quantité d'observations actuelles selon dates: 21.
Source (désignation):
Les indicateurs du développement mondiale
Source (organisation):
International Monetary Fund, Government Finance Statistics Yearbook and data files.
Catégories:
Public Sector
Dernière mise à jour
23 avr. 2017
Les indicateurs de changement de valeurs selon les années
En moyenne:
1.281 mds
Minimum:
879.7 mln.
1 janv. 1991
Maximum:
1.611 mds
1 janv. 2000
Pour la date d''observation
Valeur
Changement absolu
Le changement par rapport à la valeur précédente
1 janv. 1991
879.7 mln.
+879.7 mln.
0.0%
1 janv. 1992
1.185 mds
+305.3 mln.
34.71%
1 janv. 1993
1.446 mds
+261.5 mln.
22.07%
1 janv. 1994
1.312 mds
-134.7 mln.
-9.31%
1 janv. 1995
1.463 mds
+150.9 mln.
11.5%
1 janv. 1996
1.455 mds
-8.0 mln.
-0.55%
1 janv. 1997
1.526 mds
+71.6 mln.
4.92%
1 janv. 1998
1.447 mds
-79.7 mln.
-5.22%
1 janv. 1999
1.557 mds
+110.5 mln.
7.64%
1 janv. 2000
1.611 mds
+54.4 mln.
3.49%
1 janv. 2004
1.305 mds
-306.6 mln.
-19.03%
1 janv. 2005
1.319 mds
+14.2 mln.
1.09%
1 janv. 2006
1.018 mds
-301.1 mln.
-22.83%
1 janv. 2007
1.128 mds
+109.6 mln.
10.77%
1 janv. 2008
1.001 mds
-126.7 mln.
-11.24%
1 janv. 2009
964.8 mln.
-36.1 mln.
-3.61%
1 janv. 2010
1.045 mds
+80.0 mln.
8.29%
1 janv. 2011
1.136 mds
+91.4 mln.
8.75%
1 janv. 2012
1.247 mds
+111.0 mln.
9.77%
1 janv. 2013
1.361 mds
+113.3 mln.
9.08%
1 janv. 2014
1.486 mds
+126.0 mln.
9.26%
Classement des pays selon les statistiques actuelles par années
