29
/fr/
fr
AIzaSyAYiBZKx7MnpbEhh9jyipgxe19OcubqV5w
April 1, 2024
214249
Norway
NOR
true
2
1
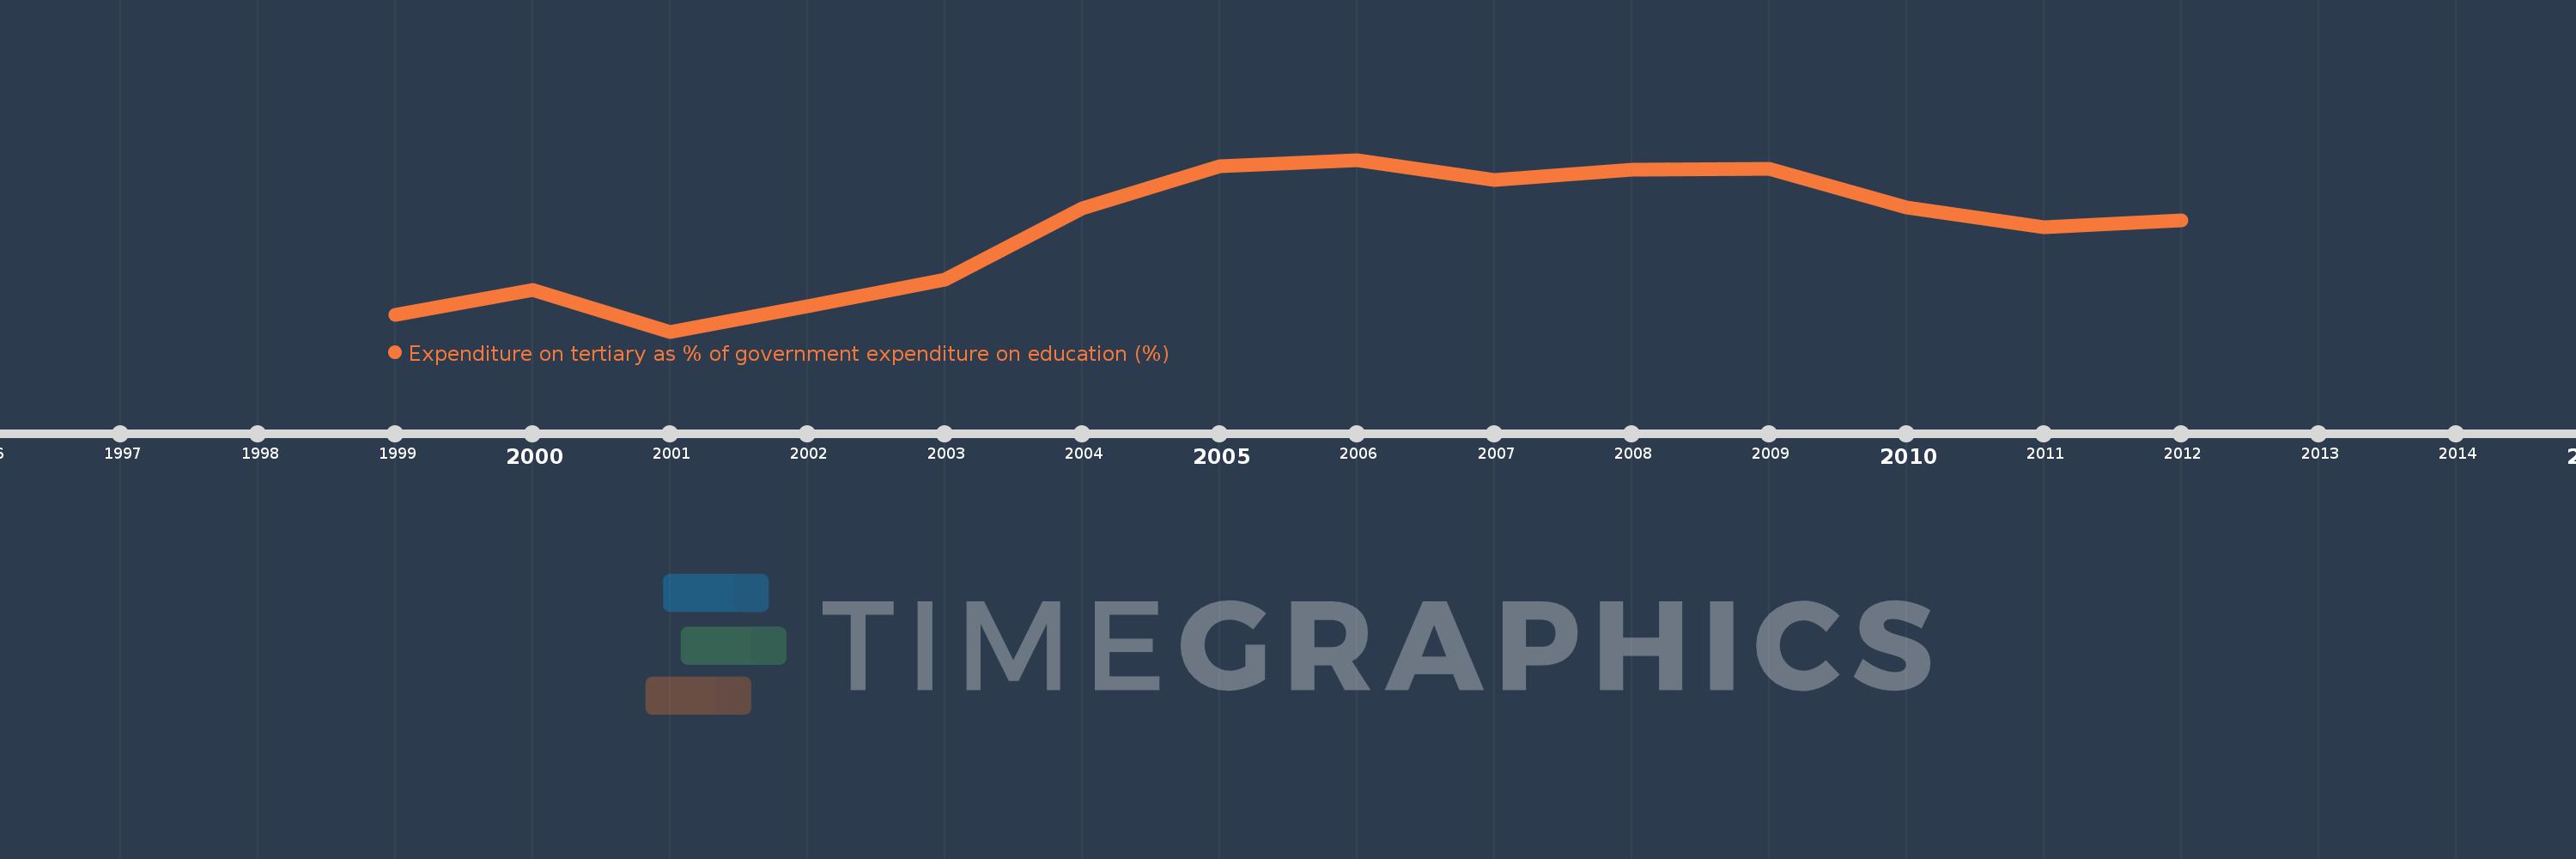
Expenditure on tertiary as % of government expenditure on education (%)
2012,2011,2010,2009,2008,2007,2006,2005,2004,2003,2002,2001,2000,1999
Cette statistique dans les autres pays:
La ligne de temps
Cette échelle de temps montre un graphique de 1999 année à 2012 année Norway. Les données jusqu'à 1998 année ne sont pas présentés. Quantité d'observations actuelles selon dates: 14.
Source (désignation):
Les indicateurs du développement mondiale
Source (organisation):
UNESCO Institute for Statistics
Catégories:
Education
Dernière mise à jour
23 avr. 2017
Les indicateurs de changement de valeurs selon les années
Minimum:
25.401
1 janv. 2001
Maximum:
32.363
1 janv. 2006
Pour la date d''observation
Valeur
Changement absolu
Le changement par rapport à la valeur précédente
1 janv. 1999
26.075
+26.075
0.0%
1 janv. 2000
27.103
+1.028
3.94%
1 janv. 2001
25.401
-1.702
-6.28%
1 janv. 2002
26.429
+1.028
4.05%
1 janv. 2003
27.503
+1.074
4.06%
1 janv. 2004
30.391
+2.888
10.5%
1 janv. 2005
32.094
+1.704
5.61%
1 janv. 2006
32.363
+0.269
0.84%
1 janv. 2007
31.546
-0.817
-2.53%
1 janv. 2008
31.947
+0.402
1.27%
1 janv. 2009
31.987
+0.04
0.12%
1 janv. 2010
30.432
-1.555
-4.86%
1 janv. 2011
29.626
-0.806
-2.65%
1 janv. 2012
29.892
+0.266
0.9%
Classement des pays selon les statistiques actuelles par années


Commentaires: