29
/fr/
fr
AIzaSyAYiBZKx7MnpbEhh9jyipgxe19OcubqV5w
April 1, 2024
212810
Nigeria
NGA
true
2
1
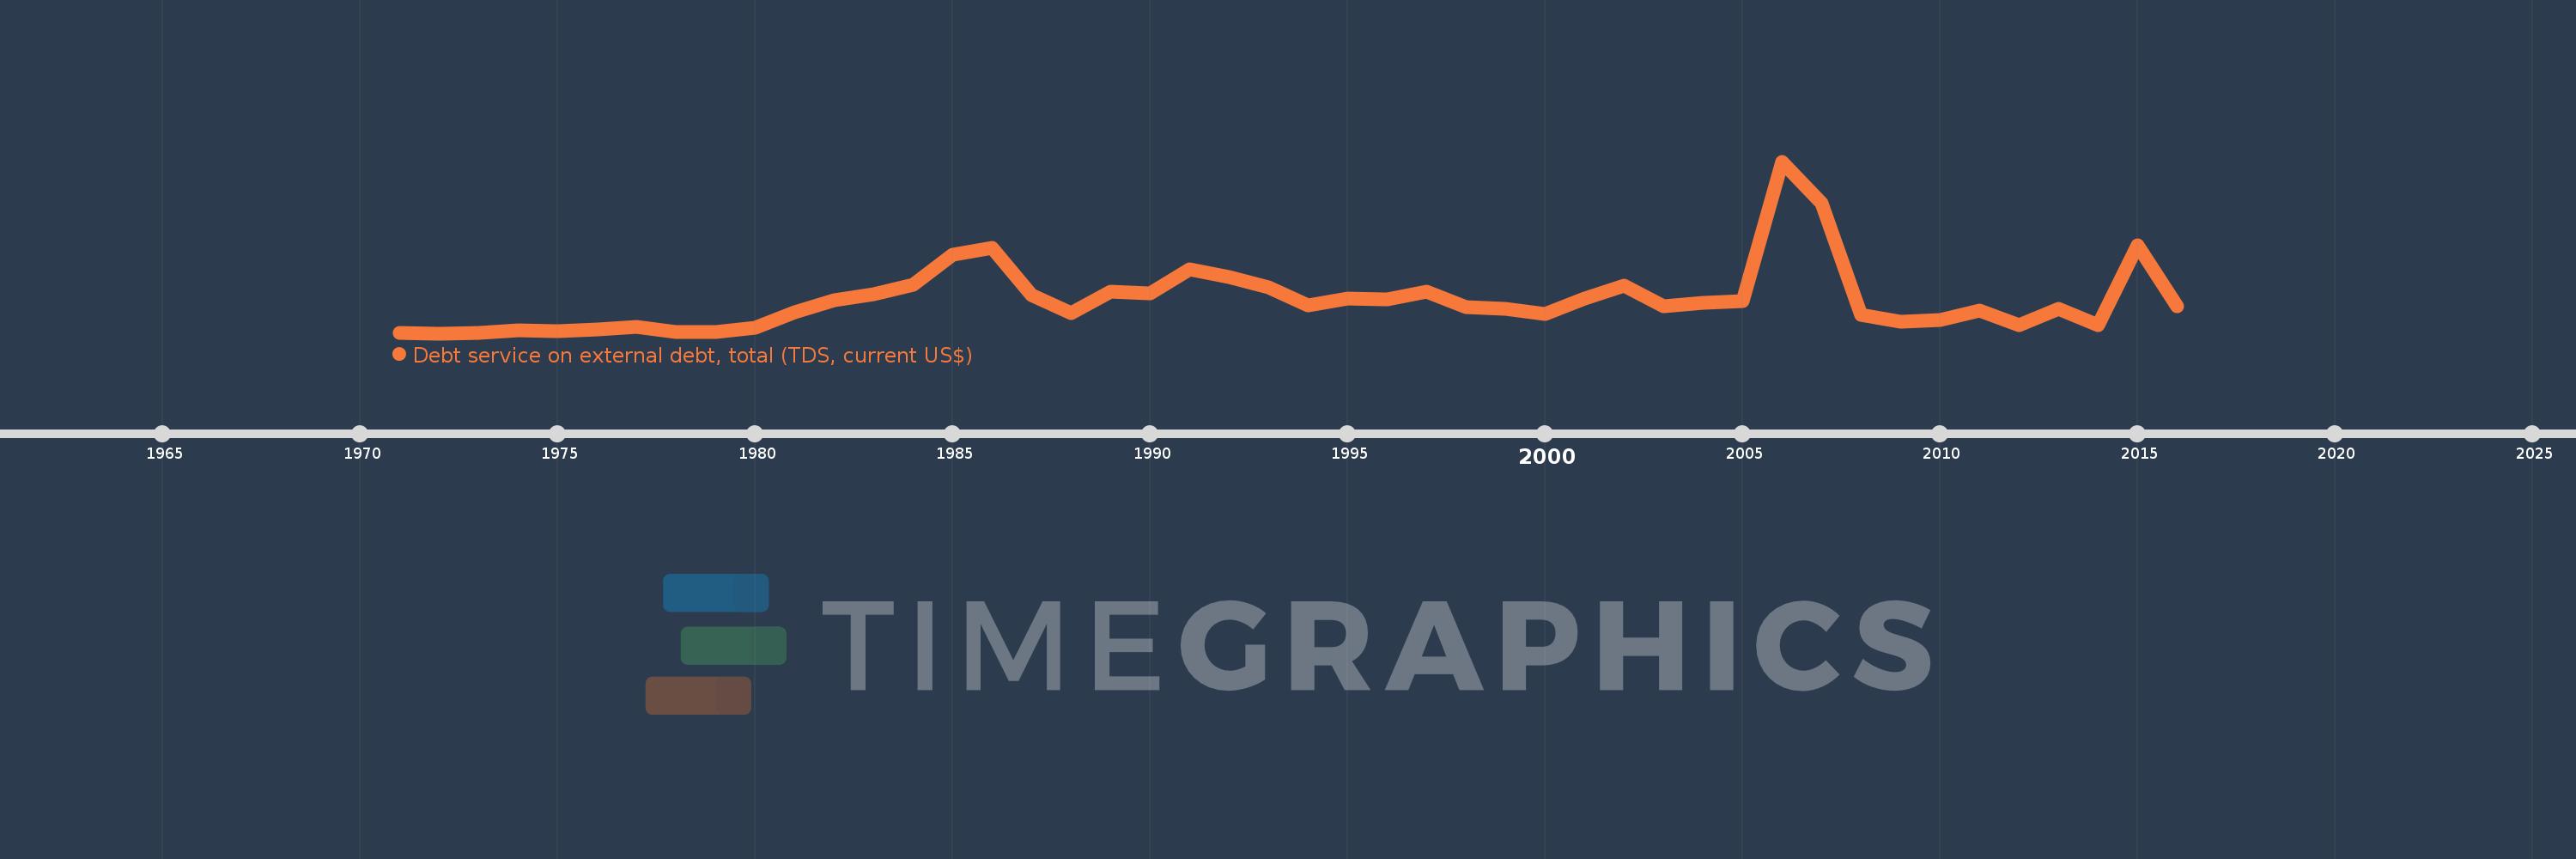
Debt service on external debt, total (TDS, current US$)
2016,2015,2014,2013,2012,2011,2010,2009,2008,2007,2006,2005,2004,2003,2002,2001,2000,1999,1998,1997,1996,1995,1994,1993,1992,1991,1990,1989,1988,1987,1986,1985,1984,1983,1982,1981,1980,1979,1978,1977,1976,1975,1974,1973,1972,1971
Cette statistique dans les autres pays:
La ligne de temps
Cette échelle de temps montre un graphique de 1971 année à 2016 année Nigeria. Les données jusqu'à 1970 année ne sont pas présentés. Quantité d'observations actuelles selon dates: 46.
Source (désignation):
Les indicateurs du développement mondiale
Source (organisation):
World Bank, International Debt Statistics.
Catégories:
External Debt
Dernière mise à jour
23 avr. 2017
Les indicateurs de changement de valeurs selon les années
Minimum:
94.469 mln.
1 janv. 1972
Maximum:
8.807 mds
1 janv. 2006
Pour la date d''observation
Valeur
Changement absolu
Le changement par rapport à la valeur précédente
1 janv. 1971
95.556 mln.
+95.556 mln.
0.0%
1 janv. 1972
94.469 mln.
-1.087 mln.
-1.14%
1 janv. 1973
95.261 mln.
+792.0 milles
0.84%
1 janv. 1974
228.669 mln.
+133.408 mln.
140.04%
1 janv. 1975
192.011 mln.
-36.658 mln.
-16.03%
1 janv. 1976
269.835 mln.
+77.824 mln.
40.53%
1 janv. 1977
400.272 mln.
+130.437 mln.
48.34%
1 janv. 1978
138.13 mln.
-262.142 mln.
-65.49%
1 janv. 1979
148.871 mln.
+10.741 mln.
7.78%
1 janv. 1980
391.8 mln.
+242.929 mln.
163.18%
1 janv. 1981
1.151 mds
+758.972 mln.
193.71%
1 janv. 1982
1.791 mds
+639.879 mln.
55.6%
1 janv. 1983
2.09 mds
+299.695 mln.
16.74%
1 janv. 1984
2.565 mds
+475.031 mln.
22.72%
1 janv. 1985
4.067 mds
+1.502 mds
58.55%
1 janv. 1986
4.429 mds
+361.169 mln.
8.88%
1 janv. 1987
2.051 mds
-2.378 mds
-53.69%
1 janv. 1988
1.106 mds
-944.349 mln.
-46.05%
1 janv. 1989
2.21 mds
+1.104 mds
99.78%
1 janv. 1990
2.117 mds
-92.944 mln.
-4.2%
1 janv. 1991
3.336 mds
+1.218 mds
57.52%
1 janv. 1992
2.945 mds
-390.79 mln.
-11.72%
1 janv. 1993
2.415 mds
-530.181 mln.
-18.0%
1 janv. 1994
1.491 mds
-923.574 mln.
-38.25%
1 janv. 1995
1.872 mds
+380.673 mln.
25.53%
1 janv. 1996
1.833 mds
-38.767 mln.
-2.07%
1 janv. 1997
2.229 mds
+395.726 mln.
21.59%
1 janv. 1998
1.416 mds
-812.734 mln.
-36.47%
1 janv. 1999
1.332 mds
-83.907 mln.
-5.93%
1 janv. 2000
1.072 mds
-259.934 mln.
-19.51%
1 janv. 2001
1.855 mds
+782.761 mln.
73.02%
1 janv. 2002
2.524 mds
+669.491 mln.
36.09%
1 janv. 2003
1.477 mds
-1.047 mds
-41.49%
1 janv. 2004
1.631 mds
+154.464 mln.
10.46%
1 janv. 2005
1.71 mds
+78.963 mln.
4.84%
1 janv. 2006
8.807 mds
+7.097 mds
414.94%
1 janv. 2007
6.71 mds
-2.097 mds
-23.81%
1 janv. 2008
1.01 mds
-5.7 mds
-84.94%
1 janv. 2009
686.065 mln.
-324.433 mln.
-32.11%
1 janv. 2010
757.175 mln.
+71.11 mln.
10.36%
1 janv. 2011
1.257 mds
+499.72 mln.
66.0%
1 janv. 2012
525.161 mln.
-731.734 mln.
-58.22%
1 janv. 2013
1.337 mds
+812.049 mln.
154.63%
1 janv. 2014
495.657 mln.
-841.553 mln.
-62.93%
1 janv. 2015
4.546 mds
+4.05 mds
817.15%
1 janv. 2016
1.47 mds
-3.076 mds
-67.67%
Classement des pays selon les statistiques actuelles par années


Commentaires: