29
/fr/
fr
AIzaSyAYiBZKx7MnpbEhh9jyipgxe19OcubqV5w
April 1, 2024
209763
New Zealand
NZL
true
2
1
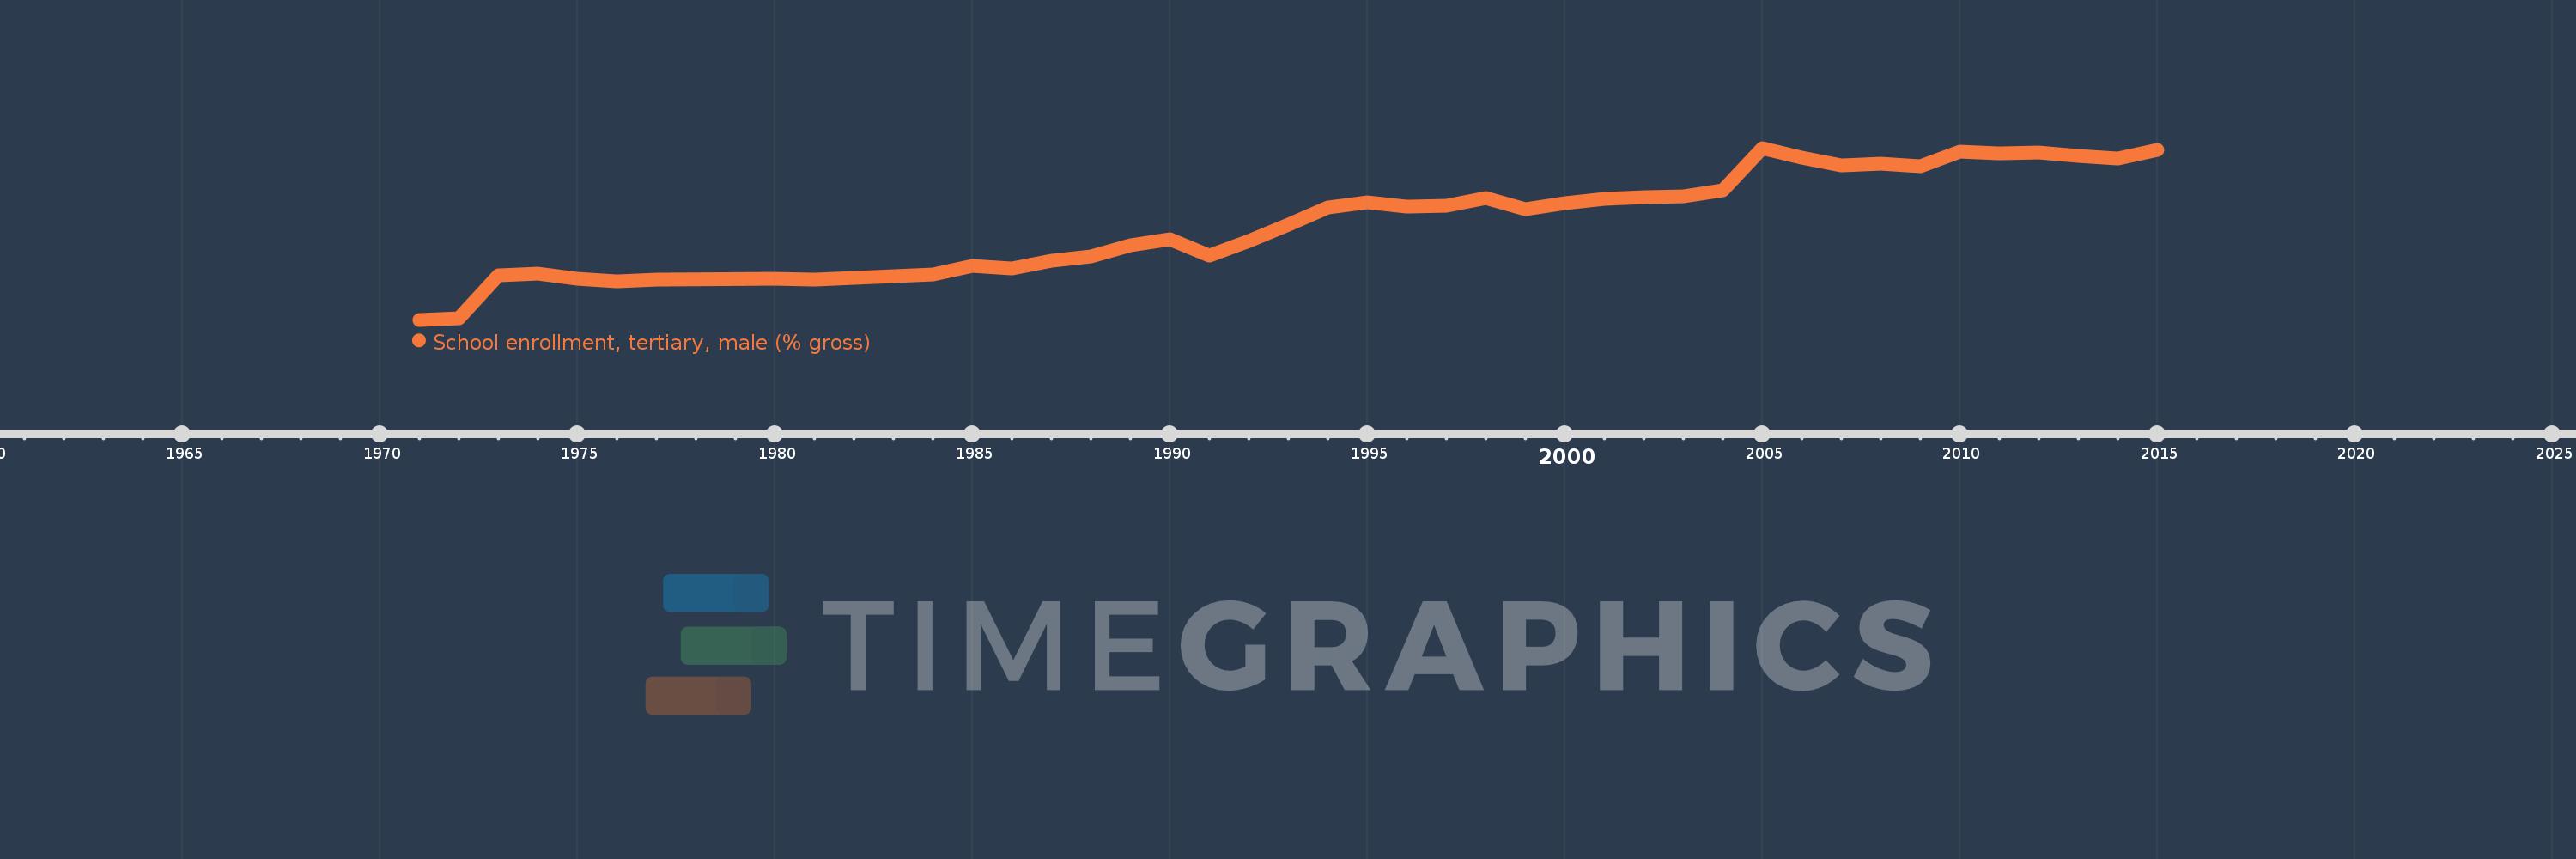
School enrollment, tertiary, male (% gross)
2015,2014,2013,2012,2011,2010,2009,2008,2007,2006,2005,2004,2003,2002,2001,2000,1999,1998,1997,1996,1995,1994,1993,1992,1991,1990,1989,1988,1987,1986,1985,1984,1983,1982,1981,1980,1977,1976,1975,1974,1973,1972,1971
Cette statistique dans les autres pays:
AfghanistanAlbaniaAlgeriaAngolaAntigua and BarbudaArab WorldArgentinaArmeniaArubaAustraliaAustriaAzerbaijanBahamas, TheBahrainBangladeshBarbadosBelarusBelgiumBelizeBeninBermudaBhutanBoliviaBosnia and HerzegovinaBotswanaBrazilBrunei DarussalamBulgariaBurkina FasoBurundiCabo VerdeCambodiaCameroonCanadaCaribbean small statesCentral African RepublicCentral Europe and the BalticsChadChileChinaColombiaComorosCongo, Dem. Rep.Congo, Rep.Costa RicaCote d'IvoireCroatiaCubaCuracaoCyprusCzech RepublicDenmarkDjiboutiDominicaDominican RepublicEarly-demographic dividendEast Asia & PacificEast Asia & Pacific (excluding high income)East Asia & Pacific (IDA & IBRD countries)EcuadorEgypt, Arab Rep.El SalvadorEquatorial GuineaEritreaEstoniaEthiopiaEuro areaEurope & Central AsiaEurope & Central Asia (excluding high income)Europe & Central Asia (IDA & IBRD countries)European UnionFijiFinlandFragile and conflict affected situationsFranceGabonGambia, TheGeorgiaGermanyGhanaGreeceGrenadaGuatemalaGuineaGuinea-BissauGuyanaHaitiHeavily indebted poor countries (HIPC)High incomeHondurasHong Kong SAR, ChinaHungaryIBRD onlyIcelandIDA & IBRD totalIDA blendIDA onlyIDA totalIndiaIndonesiaIran, Islamic Rep.IraqIrelandIsraelItalyJamaicaJapanJordanKazakhstanKenyaKorea, Dem. People’s Rep.Korea, Rep.KuwaitKyrgyz RepublicLao PDRLate-demographic dividendLatin America & Caribbean Latin America & Caribbean (excluding high income)Latin America & the Caribbean (IDA & IBRD countries)LatviaLeast developed countries: UN classificationLebanonLesothoLiberiaLibyaLiechtensteinLithuaniaLow & middle incomeLow incomeLower middle incomeLuxembourgMacao SAR, ChinaMacedonia, FYRMadagascarMalawiMaldivesMaliMaltaMarshall IslandsMauritaniaMauritiusMexicoMicronesia, Fed. Sts.Middle East & North AfricaMiddle East & North Africa (excluding high income)Middle East & North Africa (IDA & IBRD countries)Middle incomeMoldovaMongoliaMontenegroMoroccoMozambiqueMyanmarNamibiaNepalNetherlandsNew ZealandNicaraguaNigerNigeriaNorth AmericaNorwayOECD membersOmanOther small statesPacific island small statesPakistanPalauPanamaPapua New GuineaParaguayPeruPhilippinesPolandPortugalPost-demographic dividendPre-demographic dividendPuerto RicoQatarRomaniaRussian FederationRwandaSamoaSan MarinoSao Tome and PrincipeSaudi ArabiaSenegalSerbiaSeychellesSierra LeoneSingaporeSlovak RepublicSloveniaSmall statesSomaliaSouth AfricaSouth AsiaSouth Asia (IDA & IBRD)SpainSri LankaSt. Kitts and NevisSt. LuciaSt. Vincent and the GrenadinesSub-Saharan Africa Sub-Saharan Africa (excluding high income)Sub-Saharan Africa (IDA & IBRD countries)SudanSurinameSwazilandSwedenSwitzerlandSyrian Arab RepublicTajikistanTanzaniaThailandTimor-LesteTogoTongaTrinidad and TobagoTunisiaTurkeyTurkmenistanUgandaUkraineUnited Arab EmiratesUnited KingdomUnited StatesUpper middle incomeUruguayUzbekistanVanuatuVenezuela, RBVietnamWest Bank and GazaWorldYemen, Rep.ZambiaZimbabwe La ligne de temps
Cette échelle de temps montre un graphique de 1971 année à 2015 année New Zealand. Les données jusqu'à 1970 année ne sont pas présentés. Quantité d'observations actuelles selon dates: 43.
Source (désignation):
Les indicateurs du développement mondiale
Source (organisation):
United Nations Educational, Scientific, and Cultural Organization (UNESCO) Institute for Statistics.
Catégories:
Education, Gender
Dernière mise à jour
23 avr. 2017
Les indicateurs de changement de valeurs selon les années
Minimum:
19.31
1 janv. 1971
Maximum:
68.748
1 janv. 2005
Pour la date d''observation
Valeur
Changement absolu
Le changement par rapport à la valeur précédente
1 janv. 1971
19.31
+19.31
0.0%
1 janv. 1972
19.617
+0.306
1.59%
1 janv. 1973
32.177
+12.561
64.03%
1 janv. 1974
32.625
+0.448
1.39%
1 janv. 1975
31.019
-1.606
-4.92%
1 janv. 1976
30.272
-0.747
-2.41%
1 janv. 1977
30.919
+0.647
2.14%
1 janv. 1980
31.163
+0.244
0.79%
1 janv. 1981
30.915
-0.247
-0.79%
1 janv. 1982
31.352
+0.436
1.41%
1 janv. 1983
31.934
+0.583
1.86%
1 janv. 1984
32.336
+0.401
1.26%
1 janv. 1985
34.777
+2.442
7.55%
1 janv. 1986
34.145
-0.632
-1.82%
1 janv. 1987
36.334
+2.189
6.41%
1 janv. 1988
37.61
+1.276
3.51%
1 janv. 1989
40.823
+3.213
8.54%
1 janv. 1990
42.49
+1.667
4.08%
1 janv. 1991
37.858
-4.631
-10.9%
1 janv. 1992
42.03
+4.171
11.02%
1 janv. 1993
46.694
+4.665
11.1%
1 janv. 1994
51.699
+5.005
10.72%
1 janv. 1995
52.983
+1.284
2.48%
1 janv. 1996
51.77
-1.213
-2.29%
1 janv. 1997
52.047
+0.277
0.53%
1 janv. 1998
54.223
+2.176
4.18%
1 janv. 1999
51.221
-3.002
-5.54%
1 janv. 2000
52.839
+1.618
3.16%
1 janv. 2001
54.045
+1.206
2.28%
1 janv. 2002
54.546
+0.5
0.93%
1 janv. 2003
54.854
+0.309
0.57%
1 janv. 2004
56.563
+1.709
3.12%
1 janv. 2005
68.748
+12.184
21.54%
1 janv. 2006
65.835
-2.913
-4.24%
1 janv. 2007
63.702
-2.133
-3.24%
1 janv. 2008
64.195
+0.493
0.77%
1 janv. 2009
63.551
-0.644
-1.0%
1 janv. 2010
67.784
+4.233
6.66%
1 janv. 2011
67.313
-0.471
-0.69%
1 janv. 2012
67.345
+0.032
0.05%
1 janv. 2013
66.34
-1.005
-1.49%
1 janv. 2014
65.759
-0.581
-0.88%
1 janv. 2015
68.191
+2.433
3.7%
Classement des pays selon les statistiques actuelles par années


Commentaires: