29
/fr/
fr
AIzaSyAYiBZKx7MnpbEhh9jyipgxe19OcubqV5w
April 1, 2024
208087
Netherlands
NLD
true
2
1
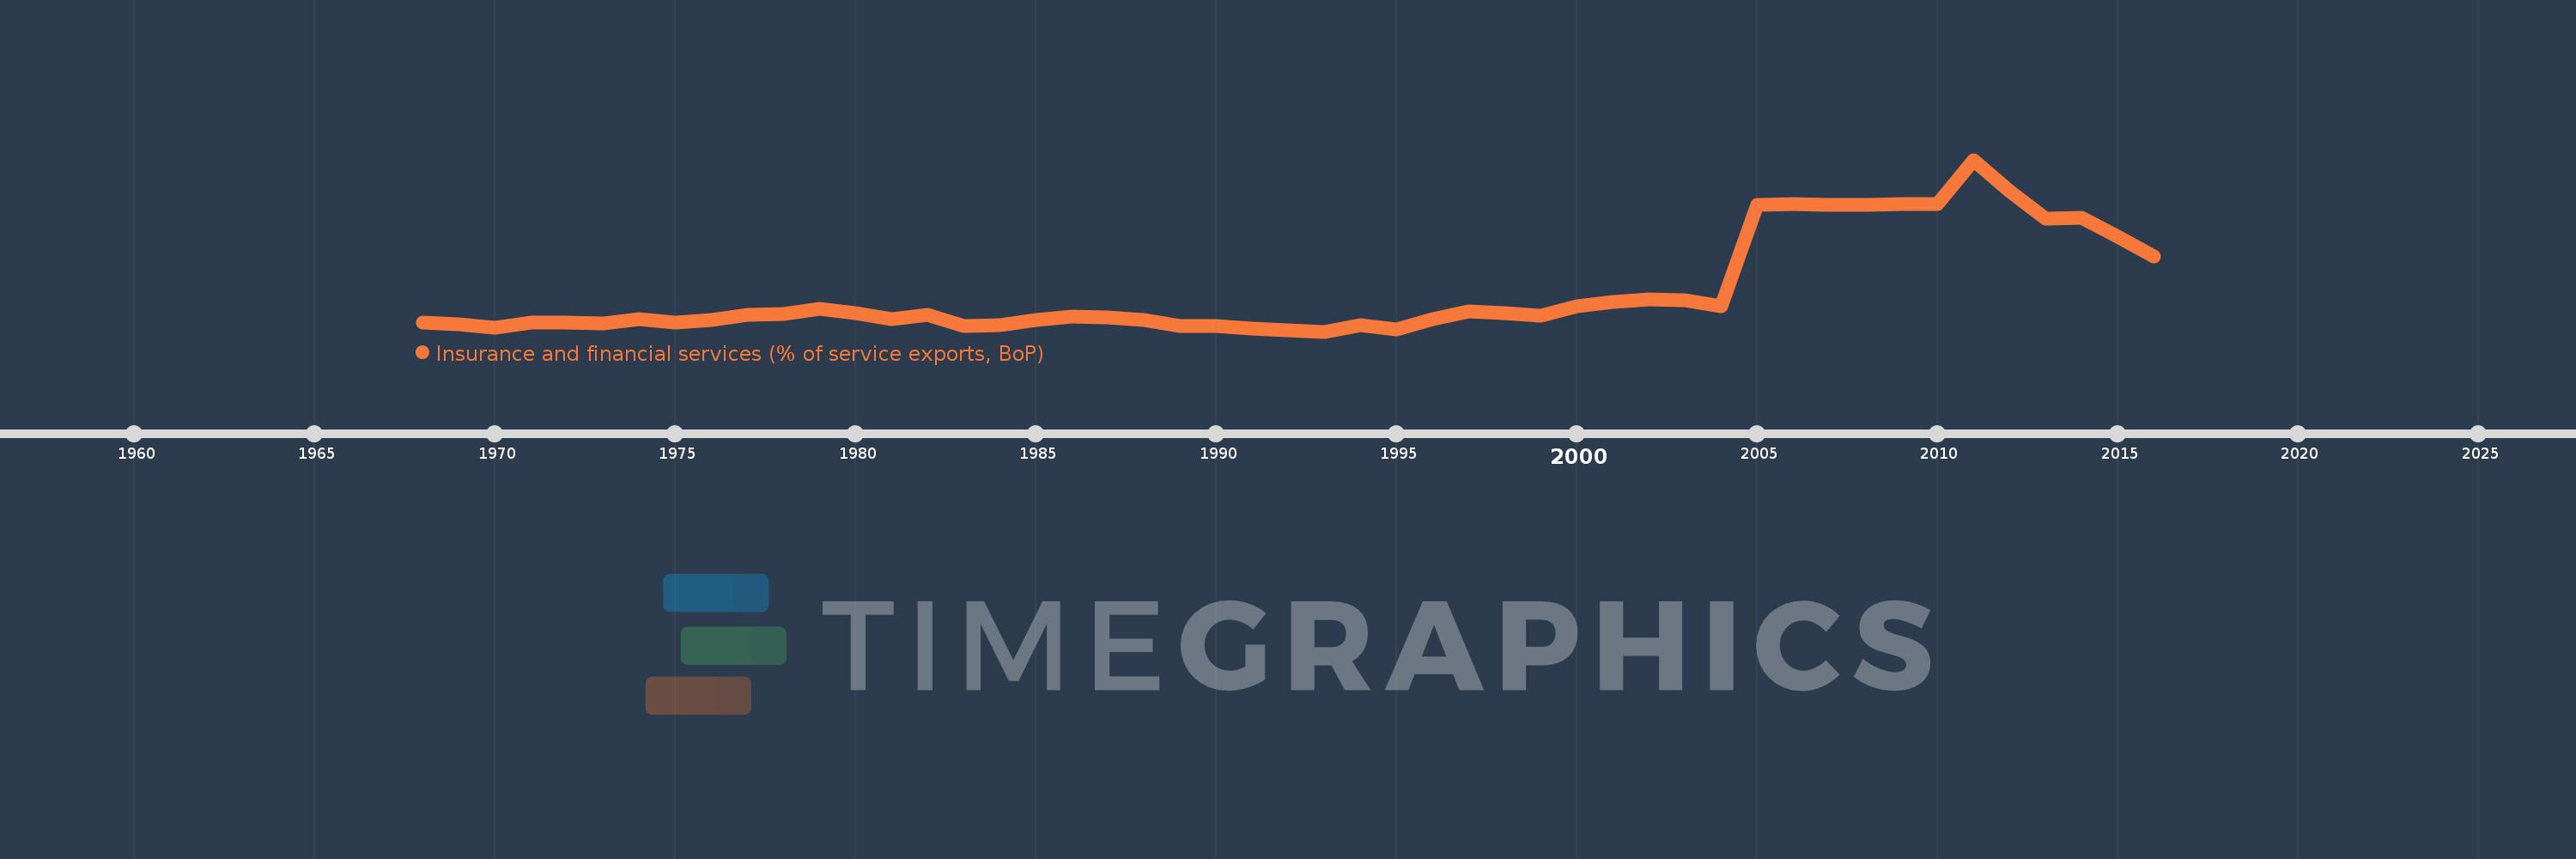
Insurance and financial services (% of service exports, BoP)
2016,2015,2014,2013,2012,2011,2010,2009,2008,2007,2006,2005,2004,2003,2002,2001,2000,1999,1998,1997,1996,1995,1994,1993,1992,1991,1990,1989,1988,1987,1986,1985,1984,1983,1982,1981,1980,1979,1978,1977,1976,1975,1974,1973,1972,1971,1970,1969,1968
Cette statistique dans les autres pays:
AfghanistanAlbaniaAlgeriaAngolaAntigua and BarbudaArab WorldArgentinaArmeniaArubaAustraliaAustriaAzerbaijanBahrainBangladeshBarbadosBelarusBelgiumBelizeBeninBermudaBhutanBoliviaBosnia and HerzegovinaBotswanaBrazilBrunei DarussalamBulgariaBurkina FasoBurundiCabo VerdeCambodiaCameroonCanadaCaribbean small statesCentral African RepublicCentral Europe and the BalticsChadChileChinaColombiaComorosCongo, Dem. Rep.Congo, Rep.Costa RicaCote d'IvoireCroatiaCuracaoCyprusCzech RepublicDenmarkDominicaDominican RepublicEarly-demographic dividendEast Asia & PacificEast Asia & Pacific (excluding high income)East Asia & Pacific (IDA & IBRD countries)EcuadorEgypt, Arab Rep.El SalvadorEritreaEstoniaEthiopiaEuro areaEurope & Central AsiaEurope & Central Asia (excluding high income)Europe & Central Asia (IDA & IBRD countries)European UnionFaroe IslandsFijiFinlandFragile and conflict affected situationsFranceFrench PolynesiaGabonGambia, TheGeorgiaGermanyGhanaGreeceGrenadaGuatemalaGuineaGuinea-BissauGuyanaHaitiHeavily indebted poor countries (HIPC)High incomeHondurasHong Kong SAR, ChinaHungaryIBRD onlyIcelandIDA & IBRD totalIDA onlyIDA totalIndiaIndonesiaIran, Islamic Rep.IraqIrelandIsraelItalyJamaicaJapanJordanKazakhstanKenyaKiribatiKorea, Rep.KosovoKuwaitKyrgyz RepublicLao PDRLate-demographic dividendLatin America & Caribbean Latin America & Caribbean (excluding high income)Latin America & the Caribbean (IDA & IBRD countries)LatviaLeast developed countries: UN classificationLebanonLesothoLiberiaLibyaLithuaniaLow & middle incomeLow incomeLower middle incomeLuxembourgMacao SAR, ChinaMacedonia, FYRMadagascarMalawiMalaysiaMaldivesMaliMaltaMauritaniaMauritiusMexicoMiddle East & North AfricaMiddle East & North Africa (excluding high income)Middle East & North Africa (IDA & IBRD countries)Middle incomeMoldovaMongoliaMontenegroMoroccoMozambiqueMyanmarNamibiaNepalNetherlandsNew CaledoniaNew ZealandNicaraguaNigerNigeriaNorth AmericaNorwayOECD membersOmanOther small statesPacific island small statesPakistanPalauPanamaPapua New GuineaParaguayPeruPhilippinesPolandPortugalPost-demographic dividendPre-demographic dividendQatarRomaniaRussian FederationRwandaSamoaSao Tome and PrincipeSaudi ArabiaSenegalSerbiaSeychellesSierra LeoneSingaporeSint Maarten (Dutch part)Slovak RepublicSloveniaSmall statesSolomon IslandsSouth AfricaSouth AsiaSouth Asia (IDA & IBRD)South SudanSpainSri LankaSt. Kitts and NevisSt. LuciaSt. Vincent and the GrenadinesSub-Saharan Africa Sub-Saharan Africa (excluding high income)Sub-Saharan Africa (IDA & IBRD countries)SudanSurinameSwazilandSwedenSwitzerlandSyrian Arab RepublicTajikistanTanzaniaThailandTimor-LesteTogoTongaTrinidad and TobagoTunisiaTurkeyTuvaluUgandaUkraineUnited KingdomUnited StatesUpper middle incomeUruguayVanuatuVenezuela, RBWest Bank and GazaWorldZambiaZimbabwe La ligne de temps
Cette échelle de temps montre un graphique de 1968 année à 2016 année Netherlands. Les données jusqu'à 1967 année ne sont pas présentés. Quantité d'observations actuelles selon dates: 49.
Source (désignation):
Les indicateurs du développement mondiale
Source (organisation):
International Monetary Fund, Balance of Payments Statistics Yearbook and data files.
Catégories:
Economy & Growth, Private Sector, Trade
Dernière mise à jour
23 avr. 2017
Les indicateurs de changement de valeurs selon les années
Minimum:
0.622
1 janv. 1993
Maximum:
7.997
1 janv. 2011
Pour la date d''observation
Valeur
Changement absolu
Le changement par rapport à la valeur précédente
1 janv. 1968
1.007
+1.007
0.0%
1 janv. 1969
0.924
-0.083
-8.27%
1 janv. 1970
0.777
-0.147
-15.92%
1 janv. 1971
1.002
+0.225
28.96%
1 janv. 1972
0.992
-0.009
-0.93%
1 janv. 1973
0.974
-0.018
-1.81%
1 janv. 1974
1.169
+0.194
19.95%
1 janv. 1975
1.026
-0.143
-12.21%
1 janv. 1976
1.135
+0.109
10.61%
1 janv. 1977
1.33
+0.196
17.23%
1 janv. 1978
1.384
+0.053
4.01%
1 janv. 1979
1.588
+0.205
14.79%
1 janv. 1980
1.426
-0.162
-10.22%
1 janv. 1981
1.151
-0.275
-19.27%
1 janv. 1982
1.349
+0.198
17.2%
1 janv. 1983
0.862
-0.487
-36.1%
1 janv. 1984
0.897
+0.035
4.01%
1 janv. 1985
1.129
+0.233
25.97%
1 janv. 1986
1.272
+0.143
12.65%
1 janv. 1987
1.224
-0.048
-3.77%
1 janv. 1988
1.116
-0.108
-8.85%
1 janv. 1989
0.854
-0.262
-23.49%
1 janv. 1990
0.846
-0.008
-0.9%
1 janv. 1991
0.735
-0.112
-13.19%
1 janv. 1992
0.663
-0.071
-9.73%
1 janv. 1993
0.622
-0.041
-6.21%
1 janv. 1994
0.892
+0.27
43.35%
1 janv. 1995
0.721
-0.171
-19.13%
1 janv. 1996
1.144
+0.423
58.67%
1 janv. 1997
1.493
+0.349
30.52%
1 janv. 1998
1.397
-0.096
-6.44%
1 janv. 1999
1.289
-0.108
-7.76%
1 janv. 2000
1.696
+0.407
31.58%
1 janv. 2001
1.884
+0.188
11.07%
1 janv. 2002
2.006
+0.123
6.51%
1 janv. 2003
1.953
-0.053
-2.64%
1 janv. 2004
1.701
-0.252
-12.9%
1 janv. 2005
6.066
+4.364
256.52%
1 janv. 2006
6.089
+0.023
0.38%
1 janv. 2007
6.07
-0.018
-0.3%
1 janv. 2008
6.065
-0.006
-0.09%
1 janv. 2009
6.098
+0.033
0.54%
1 janv. 2010
6.081
-0.017
-0.27%
1 janv. 2011
7.997
+1.916
31.51%
1 janv. 2012
6.646
-1.351
-16.9%
1 janv. 2013
5.483
-1.163
-17.49%
1 janv. 2014
5.499
+0.016
0.29%
1 janv. 2015
4.681
-0.818
-14.88%
1 janv. 2016
3.842
-0.839
-17.93%
Classement des pays selon les statistiques actuelles par années


Commentaires: