29
/fr/
fr
AIzaSyAYiBZKx7MnpbEhh9jyipgxe19OcubqV5w
April 1, 2024
207226
Nepal
NPL
true
2
1
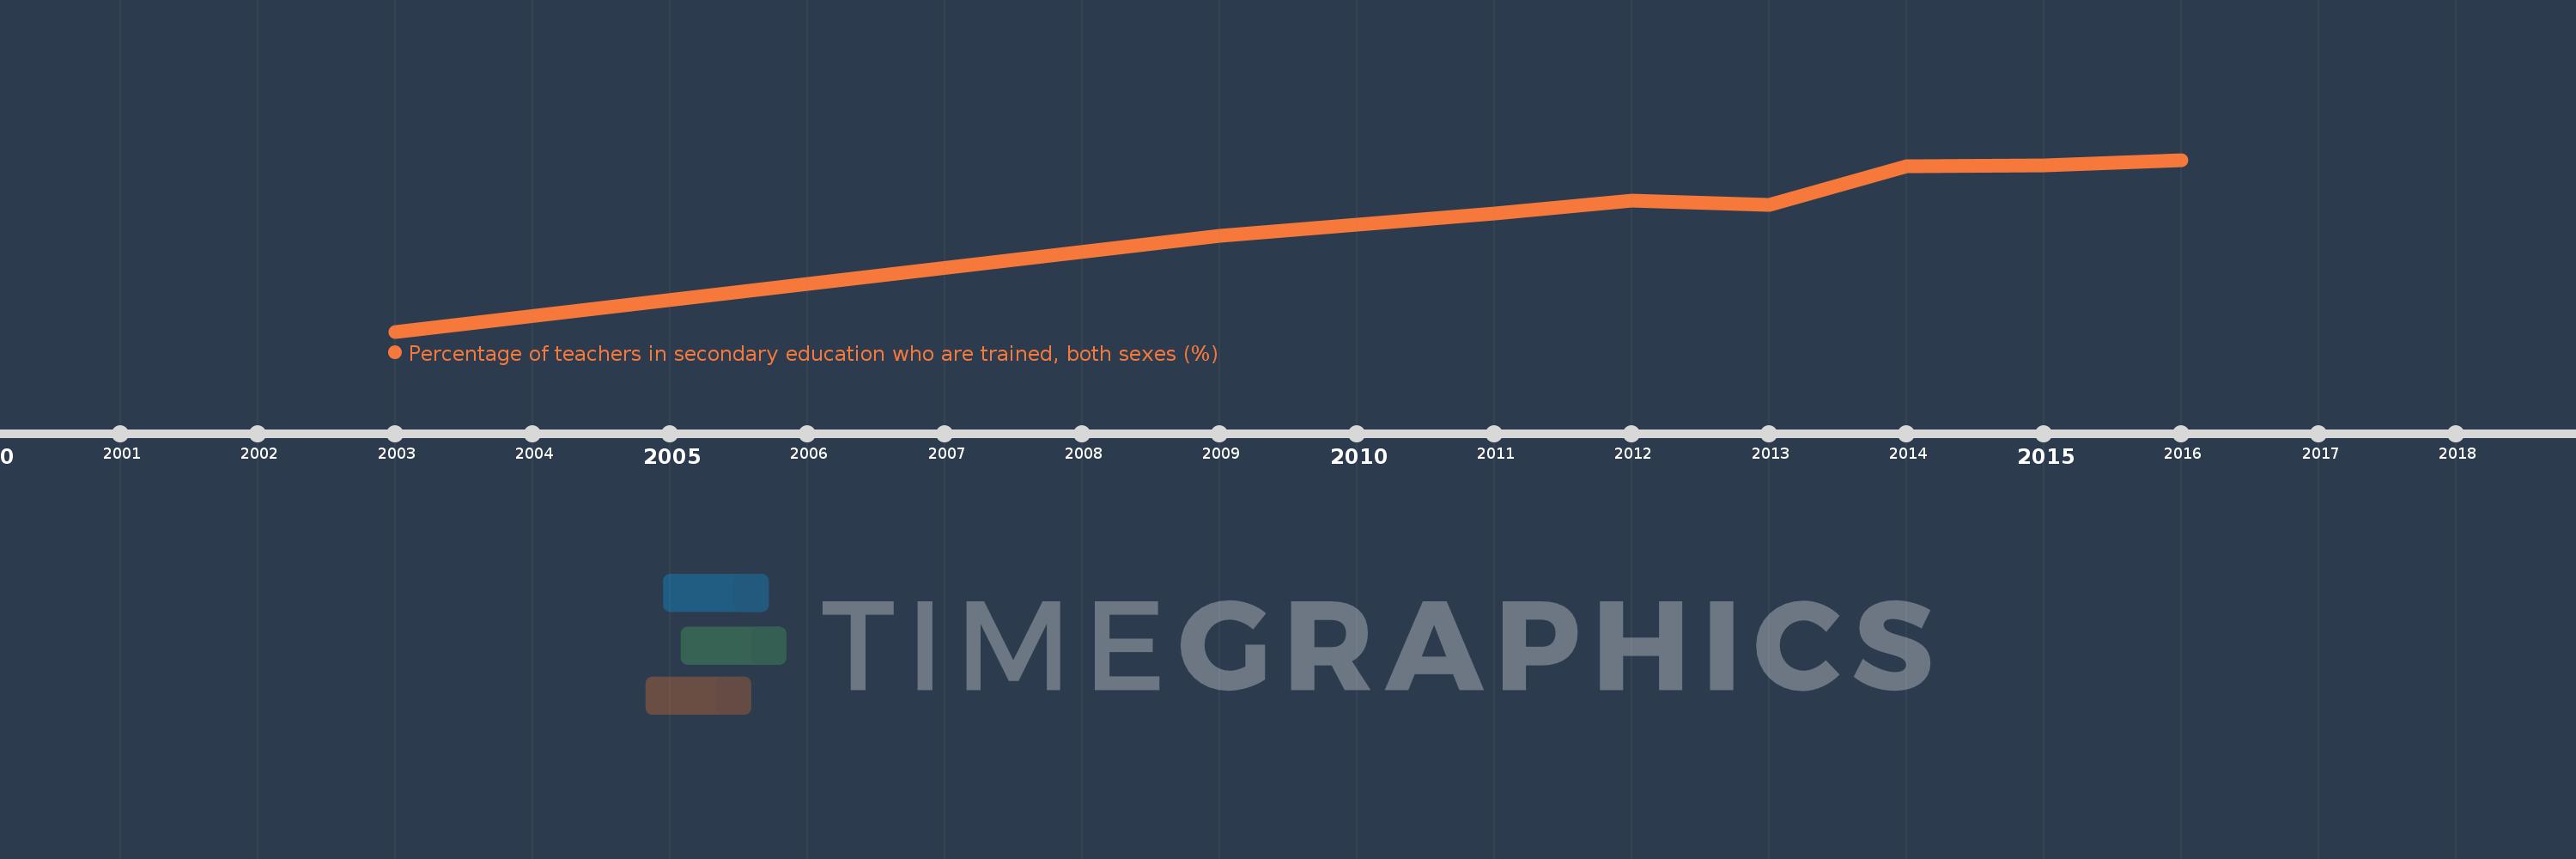
Percentage of teachers in secondary education who are trained, both sexes (%)
2016,2015,2014,2013,2012,2011,2009,2003
Cette statistique dans les autres pays:
La ligne de temps
Cette échelle de temps montre un graphique de 2003 année à 2016 année Nepal. Les données jusqu'à 2002 année ne sont pas présentés. Quantité d'observations actuelles selon dates: 8.
Source (désignation):
Les indicateurs du développement mondiale
Source (organisation):
UNESCO Institute for Statistics
Catégories:
Education
Dernière mise à jour
23 avr. 2017
Les indicateurs de changement de valeurs selon les années
Minimum:
28.214
1 janv. 2003
Maximum:
81.877
1 janv. 2016
Pour la date d''observation
Valeur
Changement absolu
Le changement par rapport à la valeur précédente
1 janv. 2003
28.214
+28.214
0.0%
1 janv. 2009
58.209
+29.994
106.31%
1 janv. 2011
65.079
+6.87
11.8%
1 janv. 2012
69.137
+4.058
6.24%
1 janv. 2013
67.734
-1.403
-2.03%
1 janv. 2014
79.769
+12.035
17.77%
1 janv. 2015
80.193
+0.424
0.53%
1 janv. 2016
81.877
+1.683
2.1%
Classement des pays selon les statistiques actuelles par années


Commentaires: