29
/fr/
fr
AIzaSyAYiBZKx7MnpbEhh9jyipgxe19OcubqV5w
April 1, 2024
206539
Nepal
NPL
true
2
1
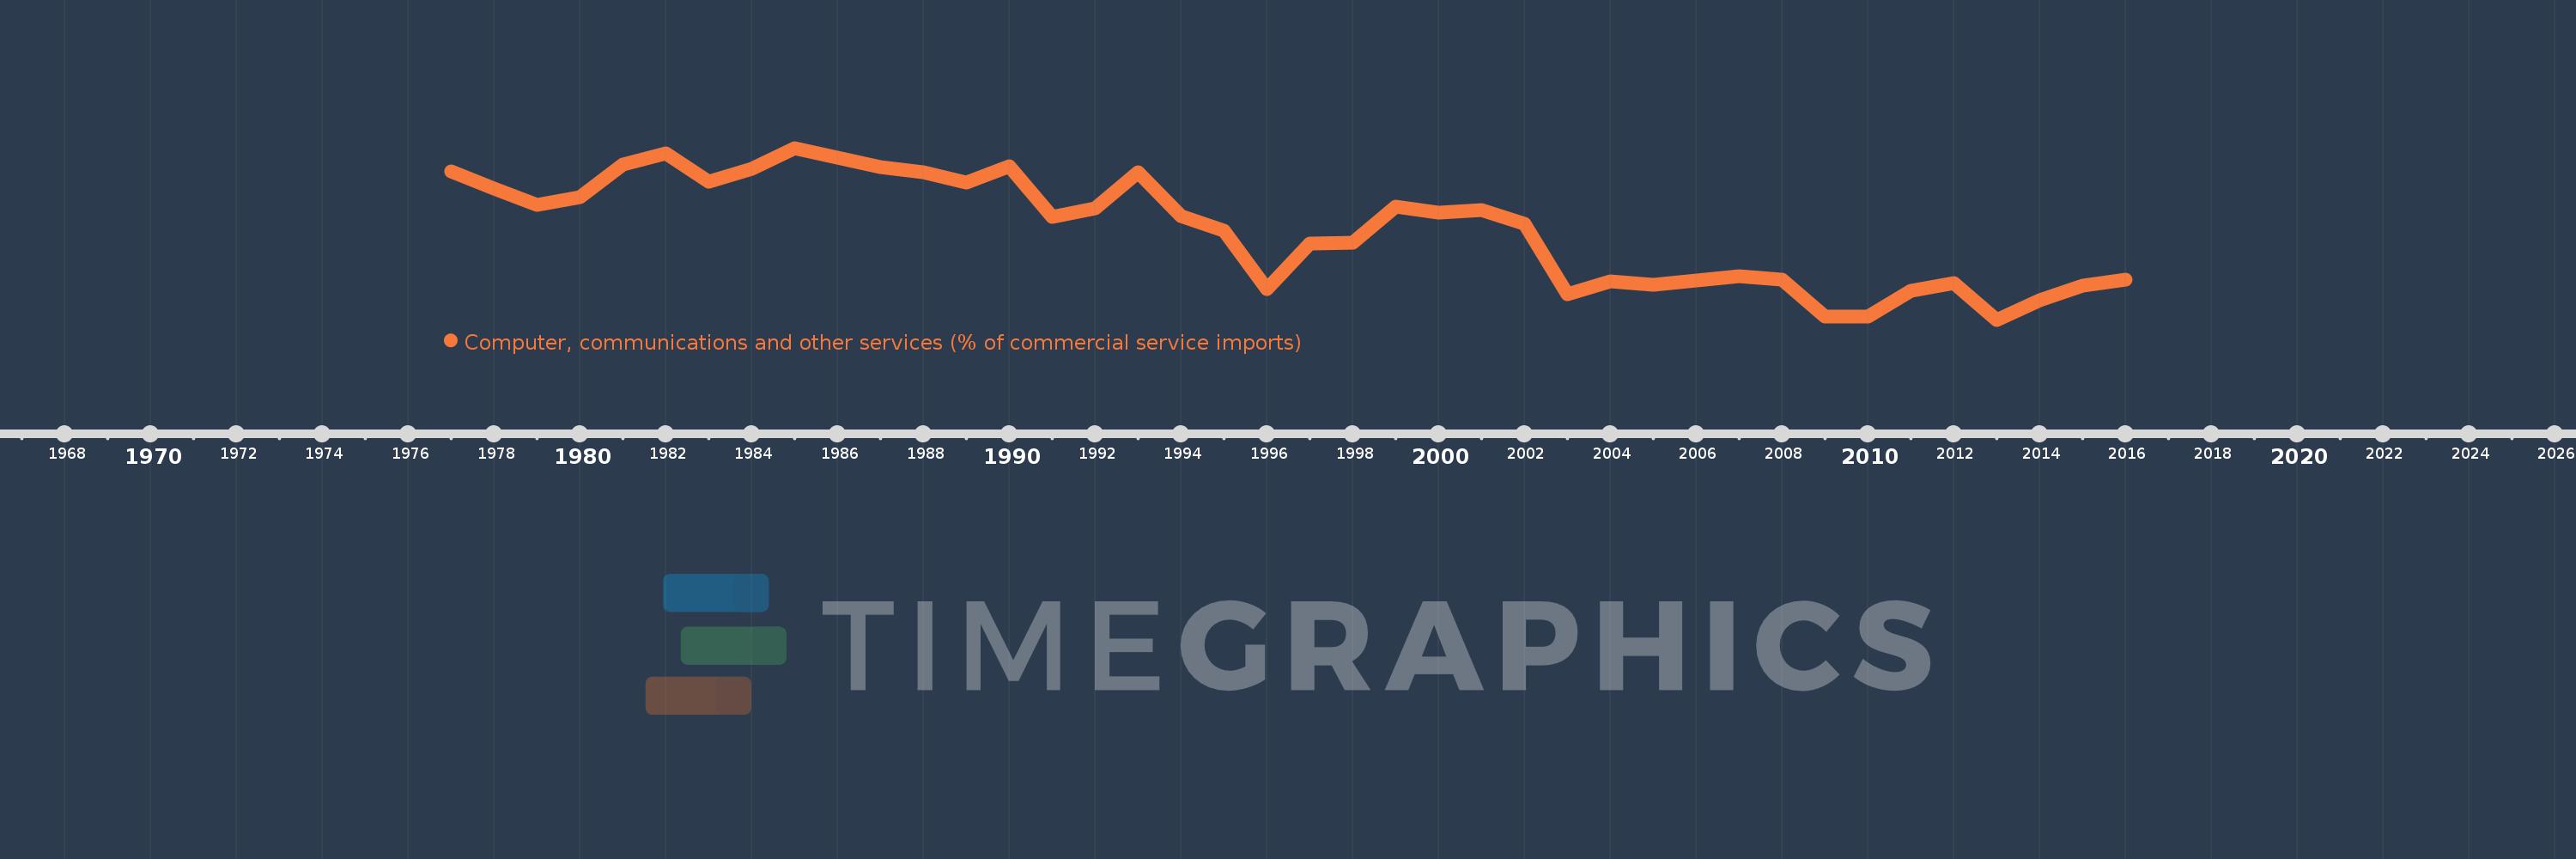
Computer, communications and other services (% of commercial service imports)
2016,2015,2014,2013,2012,2011,2010,2009,2008,2007,2006,2005,2004,2003,2002,2001,2000,1999,1998,1997,1996,1995,1994,1993,1992,1991,1990,1989,1988,1987,1986,1985,1984,1983,1982,1981,1980,1979,1978,1977
Cette statistique dans les autres pays:
AfghanistanAlbaniaAlgeriaAngolaAntigua and BarbudaArab WorldArgentinaArmeniaArubaAustraliaAustriaAzerbaijanBahamas, TheBahrainBangladeshBarbadosBelarusBelgiumBelizeBeninBermudaBhutanBoliviaBosnia and HerzegovinaBotswanaBrazilBrunei DarussalamBulgariaBurkina FasoBurundiCabo VerdeCambodiaCameroonCanadaCaribbean small statesCentral African RepublicCentral Europe and the BalticsChadChileChinaColombiaComorosCongo, Dem. Rep.Congo, Rep.Costa RicaCote d'IvoireCroatiaCuracaoCyprusCzech RepublicDenmarkDjiboutiDominicaDominican RepublicEarly-demographic dividendEast Asia & PacificEast Asia & Pacific (excluding high income)East Asia & Pacific (IDA & IBRD countries)EcuadorEgypt, Arab Rep.El SalvadorEquatorial GuineaEritreaEstoniaEthiopiaEuro areaEurope & Central AsiaEurope & Central Asia (excluding high income)Europe & Central Asia (IDA & IBRD countries)European UnionFaroe IslandsFijiFinlandFragile and conflict affected situationsFranceFrench PolynesiaGabonGambia, TheGeorgiaGermanyGhanaGreeceGrenadaGuatemalaGuineaGuinea-BissauGuyanaHaitiHeavily indebted poor countries (HIPC)High incomeHondurasHong Kong SAR, ChinaHungaryIBRD onlyIcelandIDA & IBRD totalIDA onlyIDA totalIndiaIndonesiaIran, Islamic Rep.IraqIrelandIsraelItalyJamaicaJapanJordanKazakhstanKenyaKiribatiKorea, Rep.KosovoKuwaitKyrgyz RepublicLao PDRLate-demographic dividendLatin America & Caribbean Latin America & Caribbean (excluding high income)Latin America & the Caribbean (IDA & IBRD countries)LatviaLeast developed countries: UN classificationLebanonLesothoLiberiaLibyaLithuaniaLow & middle incomeLow incomeLower middle incomeLuxembourgMacao SAR, ChinaMacedonia, FYRMadagascarMalawiMalaysiaMaldivesMaliMaltaMarshall IslandsMauritaniaMauritiusMexicoMicronesia, Fed. Sts.Middle East & North AfricaMiddle East & North Africa (excluding high income)Middle East & North Africa (IDA & IBRD countries)Middle incomeMoldovaMongoliaMontenegroMoroccoMozambiqueMyanmarNamibiaNepalNetherlandsNew CaledoniaNew ZealandNicaraguaNigerNigeriaNorth AmericaNorwayOECD membersOmanOther small statesPacific island small statesPakistanPalauPanamaPapua New GuineaParaguayPeruPhilippinesPolandPortugalPost-demographic dividendPre-demographic dividendQatarRomaniaRussian FederationRwandaSamoaSao Tome and PrincipeSaudi ArabiaSenegalSerbiaSeychellesSierra LeoneSingaporeSint Maarten (Dutch part)Slovak RepublicSloveniaSmall statesSolomon IslandsSouth AfricaSouth AsiaSouth Asia (IDA & IBRD)South SudanSpainSri LankaSt. Kitts and NevisSt. LuciaSt. Vincent and the GrenadinesSub-Saharan Africa Sub-Saharan Africa (excluding high income)Sub-Saharan Africa (IDA & IBRD countries)SudanSurinameSwazilandSwedenSwitzerlandSyrian Arab RepublicTajikistanTanzaniaThailandTimor-LesteTogoTongaTrinidad and TobagoTunisiaTurkeyTuvaluUgandaUkraineUnited KingdomUnited StatesUpper middle incomeUruguayVanuatuVenezuela, RBWest Bank and GazaWorldYemen, Rep.ZambiaZimbabwe La ligne de temps
Cette échelle de temps montre un graphique de 1977 année à 2016 année Nepal. Les données jusqu'à 1976 année ne sont pas présentés. Quantité d'observations actuelles selon dates: 40.
Source (désignation):
Les indicateurs du développement mondiale
Source (organisation):
International Monetary Fund, Balance of Payments Statistics Yearbook and data files.
Catégories:
Private Sector, Trade
Dernière mise à jour
23 avr. 2017
Les indicateurs de changement de valeurs selon les années
Minimum:
11.016
1 janv. 2013
Maximum:
38.467
1 janv. 1985
Pour la date d''observation
Valeur
Changement absolu
Le changement par rapport à la valeur précédente
1 janv. 1977
34.777
+34.777
0.0%
1 janv. 1978
32.039
-2.738
-7.87%
1 janv. 1979
29.434
-2.605
-8.13%
1 janv. 1980
30.616
+1.182
4.02%
1 janv. 1981
35.834
+5.218
17.04%
1 janv. 1982
37.584
+1.75
4.88%
1 janv. 1983
33.039
-4.545
-12.09%
1 janv. 1984
35.178
+2.139
6.47%
1 janv. 1985
38.467
+3.29
9.35%
1 janv. 1986
36.875
-1.593
-4.14%
1 janv. 1987
35.364
-1.511
-4.1%
1 janv. 1988
34.558
-0.806
-2.28%
1 janv. 1989
32.982
-1.576
-4.56%
1 janv. 1990
35.604
+2.622
7.95%
1 janv. 1991
27.486
-8.118
-22.8%
1 janv. 1992
28.791
+1.305
4.75%
1 janv. 1993
34.554
+5.763
20.02%
1 janv. 1994
27.629
-6.925
-20.04%
1 janv. 1995
25.247
-2.382
-8.62%
1 janv. 1996
15.928
-9.318
-36.91%
1 janv. 1997
23.188
+7.26
45.58%
1 janv. 1998
23.299
+0.111
0.48%
1 janv. 1999
29.142
+5.843
25.08%
1 janv. 2000
28.166
-0.976
-3.35%
1 janv. 2001
28.545
+0.379
1.35%
1 janv. 2002
26.279
-2.267
-7.94%
1 janv. 2003
15.036
-11.243
-42.78%
1 janv. 2004
17.169
+2.133
14.18%
1 janv. 2005
16.573
-0.595
-3.47%
1 janv. 2006
17.336
+0.763
4.6%
1 janv. 2007
18.014
+0.678
3.91%
1 janv. 2008
17.384
-0.63
-3.5%
1 janv. 2009
11.546
-5.838
-33.58%
1 janv. 2010
11.575
+0.029
0.25%
1 janv. 2011
15.694
+4.12
35.59%
1 janv. 2012
16.868
+1.174
7.48%
1 janv. 2013
11.016
-5.853
-34.7%
1 janv. 2014
14.072
+3.056
27.74%
1 janv. 2015
16.442
+2.37
16.84%
1 janv. 2016
17.44
+0.998
6.07%
Classement des pays selon les statistiques actuelles par années


Commentaires: