29
/fr/
fr
AIzaSyAYiBZKx7MnpbEhh9jyipgxe19OcubqV5w
April 1, 2024
203830
Myanmar
MMR
true
2
1
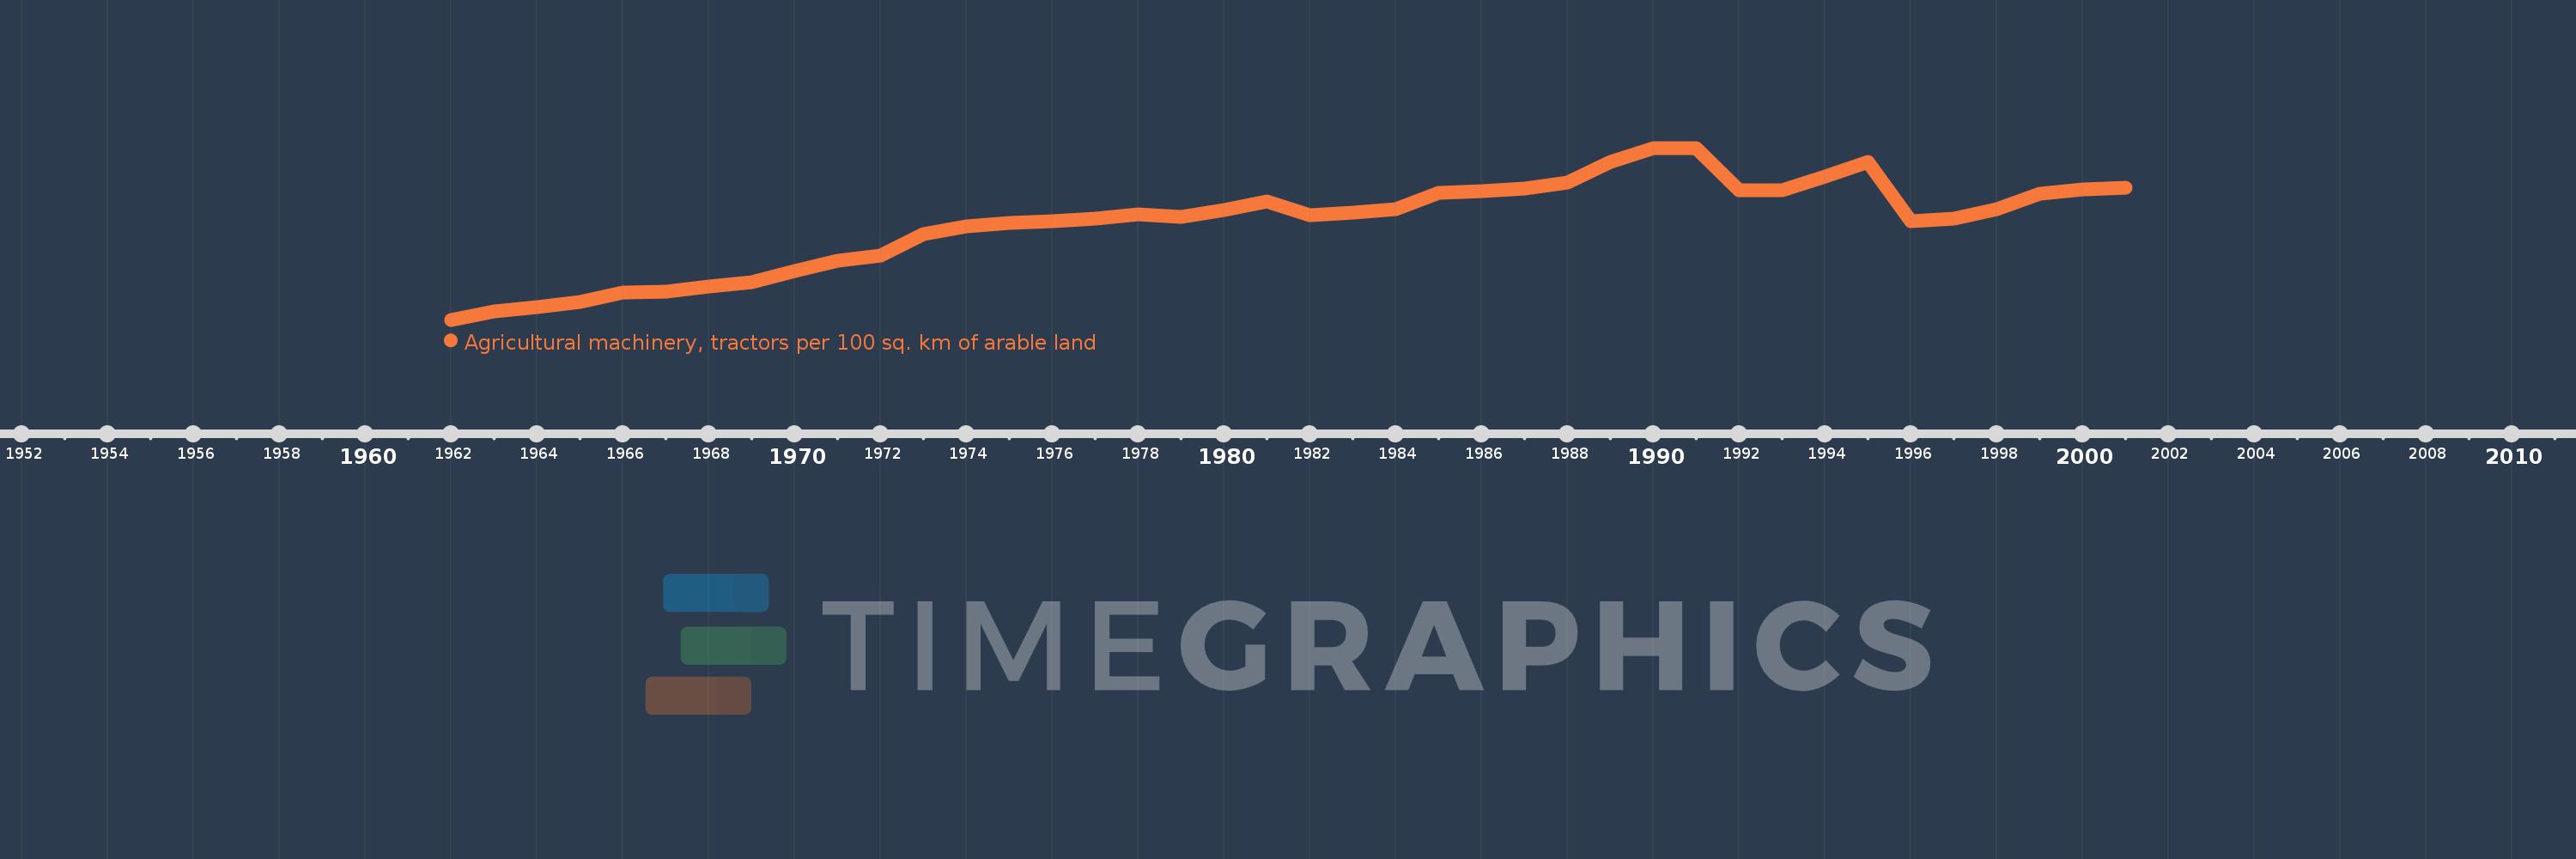
Agricultural machinery, tractors per 100 sq. km of arable land
2001,2000,1999,1998,1997,1996,1995,1994,1993,1992,1991,1990,1989,1988,1987,1986,1985,1984,1983,1982,1981,1980,1979,1978,1977,1976,1975,1974,1973,1972,1971,1970,1969,1968,1967,1966,1965,1964,1963,1962
Cette statistique dans les autres pays:
AfghanistanAlbaniaAlgeriaAmerican SamoaAndorraAngolaAntigua and BarbudaArab WorldArgentinaArmeniaAustraliaAustriaAzerbaijanBahamas, TheBahrainBangladeshBarbadosBelarusBelgiumBelizeBeninBermudaBhutanBoliviaBosnia and HerzegovinaBotswanaBrazilBritish Virgin IslandsBrunei DarussalamBulgariaBurkina FasoBurundiCabo VerdeCambodiaCameroonCanadaCaribbean small statesCentral African RepublicCentral Europe and the BalticsChadChileChinaColombiaCongo, Dem. Rep.Congo, Rep.Costa RicaCote d'IvoireCroatiaCubaCyprusCzech RepublicDenmarkDjiboutiDominicaDominican RepublicEarly-demographic dividendEast Asia & PacificEast Asia & Pacific (excluding high income)East Asia & Pacific (IDA & IBRD countries)EcuadorEgypt, Arab Rep.El SalvadorEritreaEstoniaEuro areaEurope & Central AsiaEurope & Central Asia (excluding high income)Europe & Central Asia (IDA & IBRD countries)European UnionFijiFinlandFragile and conflict affected situationsFranceFrench PolynesiaGambia, TheGeorgiaGermanyGhanaGreeceGrenadaGuamGuatemalaGuineaGuinea-BissauGuyanaHaitiHeavily indebted poor countries (HIPC)High incomeHondurasHungaryIBRD onlyIcelandIDA & IBRD totalIDA blendIDA onlyIDA totalIndiaIndonesiaIran, Islamic Rep.IraqIrelandIsraelItalyJamaicaJapanJordanKazakhstanKenyaKiribatiKorea, Dem. People’s Rep.Korea, Rep.KuwaitKyrgyz RepublicLao PDRLate-demographic dividendLatin America & Caribbean Latin America & Caribbean (excluding high income)Latin America & the Caribbean (IDA & IBRD countries)LatviaLeast developed countries: UN classificationLebanonLesothoLibyaLiechtensteinLithuaniaLow & middle incomeLow incomeLower middle incomeLuxembourgMacedonia, FYRMadagascarMalawiMalaysiaMaliMaltaMauritaniaMauritiusMexicoMiddle East & North AfricaMiddle East & North Africa (excluding high income)Middle East & North Africa (IDA & IBRD countries)Middle incomeMoldovaMongoliaMoroccoMozambiqueMyanmarNepalNetherlandsNew CaledoniaNew ZealandNicaraguaNigerNigeriaNorth AmericaNorthern Mariana IslandsNorwayOECD membersOmanOther small statesPakistanPanamaPapua New GuineaParaguayPeruPhilippinesPolandPortugalPost-demographic dividendPre-demographic dividendPuerto RicoQatarRomaniaRussian FederationRwandaSamoaSao Tome and PrincipeSaudi ArabiaSenegalSerbiaSeychellesSierra LeoneSlovak RepublicSloveniaSmall statesSolomon IslandsSomaliaSouth AfricaSouth AsiaSouth Asia (IDA & IBRD)SpainSri LankaSt. Kitts and NevisSt. LuciaSt. Vincent and the GrenadinesSub-Saharan Africa Sub-Saharan Africa (excluding high income)Sub-Saharan Africa (IDA & IBRD countries)SudanSurinameSwazilandSwedenSwitzerlandSyrian Arab RepublicTajikistanTanzaniaThailandTimor-LesteTogoTongaTrinidad and TobagoTunisiaTurkeyTurkmenistanUgandaUkraineUnited Arab EmiratesUnited KingdomUnited StatesUpper middle incomeUruguayVanuatuVenezuela, RBVietnamVirgin Islands (U.S.)West Bank and GazaWorldYemen, Rep.ZambiaZimbabwe La ligne de temps
Cette échelle de temps montre un graphique de 1962 année à 2001 année Myanmar. Les données jusqu'à 1961 année ne sont pas présentés. Quantité d'observations actuelles selon dates: 40.
Source (désignation):
Les indicateurs du développement mondiale
Source (organisation):
Food and Agriculture Organization, electronic files and web site.
Catégories:
Agriculture & Rural Development
Dernière mise à jour
23 avr. 2017
Les indicateurs de changement de valeurs selon les années
Minimum:
0.909
1 janv. 1962
Maximum:
13.63
1 janv. 1990
Pour la date d''observation
Valeur
Changement absolu
Le changement par rapport à la valeur précédente
1 janv. 1962
0.909
+0.909
0.0%
1 janv. 1963
1.514
+0.605
66.5%
1 janv. 1964
1.815
+0.301
19.88%
1 janv. 1965
2.216
+0.401
22.1%
1 janv. 1966
2.911
+0.696
31.41%
1 janv. 1967
3.018
+0.107
3.67%
1 janv. 1968
3.359
+0.341
11.3%
1 janv. 1969
3.666
+0.307
9.13%
1 janv. 1970
4.495
+0.829
22.63%
1 janv. 1971
5.275
+0.779
17.34%
1 janv. 1972
5.632
+0.357
6.77%
1 janv. 1973
7.253
+1.621
28.78%
1 janv. 1974
7.802
+0.549
7.57%
1 janv. 1975
8.069
+0.268
3.43%
1 janv. 1976
8.206
+0.137
1.7%
1 janv. 1977
8.405
+0.199
2.42%
1 janv. 1978
8.711
+0.306
3.64%
1 janv. 1979
8.551
-0.16
-1.84%
1 janv. 1980
9.053
+0.502
5.87%
1 janv. 1981
9.687
+0.634
7.0%
1 janv. 1982
8.621
-1.066
-11.01%
1 janv. 1983
8.865
+0.244
2.83%
1 janv. 1984
9.097
+0.232
2.62%
1 janv. 1985
10.279
+1.182
13.0%
1 janv. 1986
10.451
+0.172
1.67%
1 janv. 1987
10.634
+0.182
1.74%
1 janv. 1988
11.089
+0.456
4.29%
1 janv. 1989
12.563
+1.473
13.29%
1 janv. 1990
13.63
+1.067
8.49%
1 janv. 1991
13.588
-0.041
-0.3%
1 janv. 1992
10.467
-3.122
-22.97%
1 janv. 1993
10.489
+0.022
0.21%
1 janv. 1994
11.483
+0.995
9.48%
1 janv. 1995
12.587
+1.103
9.61%
1 janv. 1996
8.195
-4.392
-34.89%
1 janv. 1997
8.421
+0.226
2.76%
1 janv. 1998
9.101
+0.681
8.08%
1 janv. 1999
10.258
+1.157
12.71%
1 janv. 2000
10.536
+0.277
2.7%
1 janv. 2001
10.703
+0.168
1.59%
Classement des pays selon les statistiques actuelles par années


Commentaires: