29
/fr/
fr
AIzaSyAYiBZKx7MnpbEhh9jyipgxe19OcubqV5w
April 1, 2024
203050
Mozambique
MOZ
true
2
1
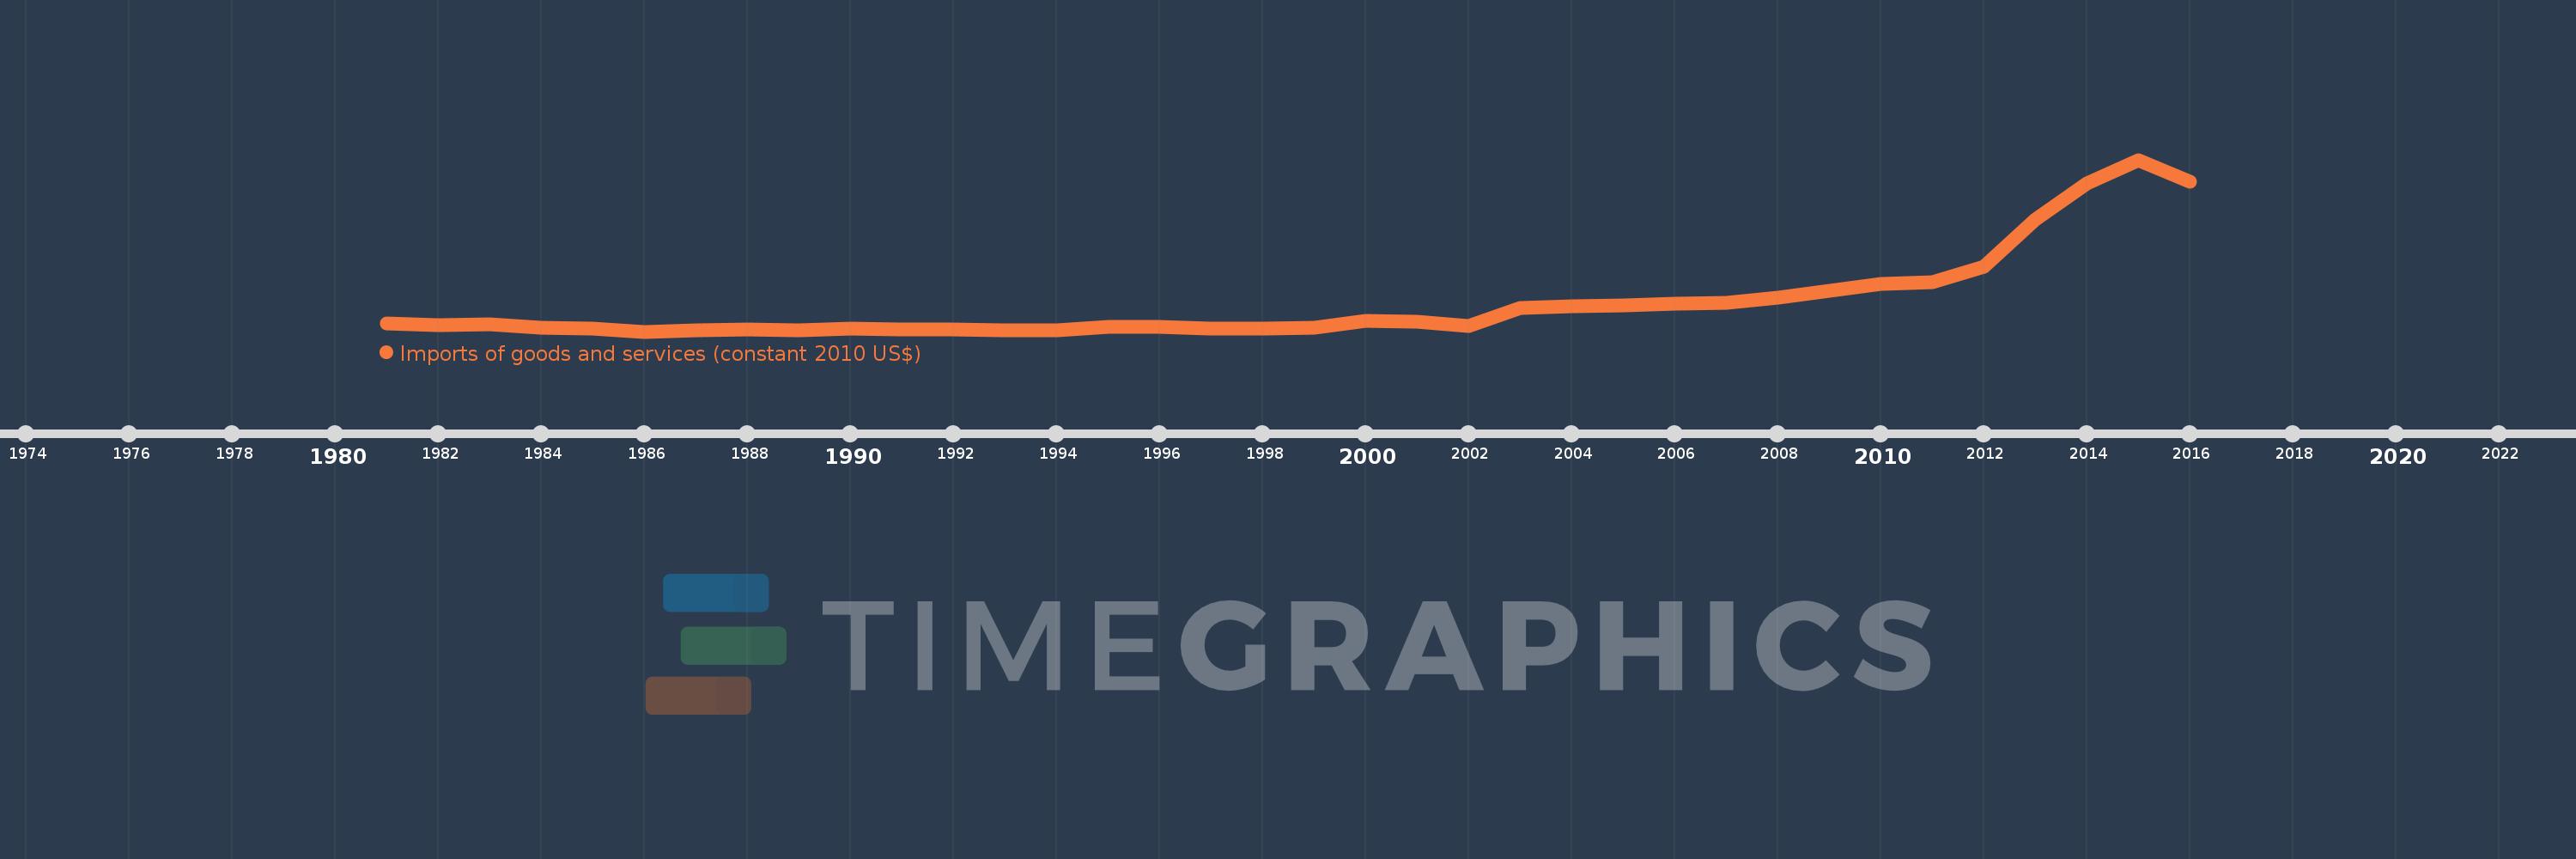
Imports of goods and services (constant 2010 US$)
2016,2015,2014,2013,2012,2011,2010,2009,2008,2007,2006,2005,2004,2003,2002,2001,2000,1999,1998,1997,1996,1995,1994,1993,1992,1991,1990,1989,1988,1987,1986,1985,1984,1983,1982,1981
Cette statistique dans les autres pays:
AfghanistanAlbaniaAlgeriaAngolaAntigua and BarbudaArab WorldArgentinaArmeniaArubaAustraliaAustriaAzerbaijanBahamas, TheBahrainBangladeshBarbadosBelarusBelgiumBelizeBeninBermudaBhutanBoliviaBosnia and HerzegovinaBotswanaBrazilBrunei DarussalamBulgariaBurkina FasoBurundiCabo VerdeCambodiaCameroonCanadaCaribbean small statesCentral African RepublicCentral Europe and the BalticsChadChileChinaColombiaComorosCongo, Dem. Rep.Congo, Rep.Costa RicaCote d'IvoireCroatiaCubaCyprusCzech RepublicDenmarkDominicaDominican RepublicEarly-demographic dividendEast Asia & PacificEast Asia & Pacific (excluding high income)East Asia & Pacific (IDA & IBRD countries)EcuadorEgypt, Arab Rep.El SalvadorEquatorial GuineaEritreaEstoniaEuro areaEurope & Central AsiaEurope & Central Asia (excluding high income)Europe & Central Asia (IDA & IBRD countries)European UnionFaroe IslandsFijiFinlandFragile and conflict affected situationsFranceGabonGambia, TheGeorgiaGermanyGhanaGreeceGrenadaGuatemalaGuineaGuinea-BissauGuyanaHaitiHeavily indebted poor countries (HIPC)High incomeHondurasHong Kong SAR, ChinaHungaryIBRD onlyIcelandIDA & IBRD totalIDA blendIDA onlyIDA totalIndiaIndonesiaIran, Islamic Rep.IraqIrelandIsraelItalyJamaicaJapanJordanKazakhstanKenyaKiribatiKorea, Rep.KosovoKuwaitKyrgyz RepublicLao PDRLate-demographic dividendLatin America & Caribbean Latin America & Caribbean (excluding high income)Latin America & the Caribbean (IDA & IBRD countries)LatviaLeast developed countries: UN classificationLebanonLiberiaLibyaLithuaniaLow & middle incomeLow incomeLower middle incomeLuxembourgMacao SAR, ChinaMacedonia, FYRMadagascarMalawiMalaysiaMaldivesMaliMaltaMauritaniaMauritiusMexicoMiddle East & North AfricaMiddle East & North Africa (excluding high income)Middle East & North Africa (IDA & IBRD countries)Middle incomeMoldovaMongoliaMontenegroMoroccoMozambiqueMyanmarNamibiaNepalNetherlandsNew ZealandNicaraguaNigerNigeriaNorth AmericaNorwayOECD membersOmanOther small statesPacific island small statesPakistanPalauPanamaParaguayPeruPhilippinesPolandPortugalPost-demographic dividendPre-demographic dividendPuerto RicoQatarRomaniaRussian FederationRwandaSamoaSaudi ArabiaSenegalSerbiaSeychellesSierra LeoneSingaporeSlovak RepublicSloveniaSmall statesSolomon IslandsSouth AfricaSouth AsiaSouth Asia (IDA & IBRD)South SudanSpainSri LankaSt. Kitts and NevisSt. LuciaSt. Vincent and the GrenadinesSub-Saharan Africa Sub-Saharan Africa (excluding high income)Sub-Saharan Africa (IDA & IBRD countries)SudanSurinameSwazilandSwedenSwitzerlandTajikistanTanzaniaThailandTimor-LesteTogoTongaTrinidad and TobagoTunisiaTurkeyTurkmenistanUgandaUkraineUnited Arab EmiratesUnited KingdomUnited StatesUpper middle incomeUruguayUzbekistanVanuatuVenezuela, RBVietnamWest Bank and GazaWorldYemen, Rep.ZambiaZimbabwe La ligne de temps
Cette échelle de temps montre un graphique de 1981 année à 2016 année Mozambique. Les données jusqu'à 1980 année ne sont pas présentés. Quantité d'observations actuelles selon dates: 36.
Source (désignation):
Les indicateurs du développement mondiale
Source (organisation):
World Bank national accounts data, and OECD National Accounts data files.
Catégories:
Economy & Growth, Trade
Dernière mise à jour
23 avr. 2017
Les indicateurs de changement de valeurs selon les années
Minimum:
924.474 mln.
1 janv. 1986
Maximum:
14.131 mds
1 janv. 2015
Pour la date d''observation
Valeur
Changement absolu
Le changement par rapport à la valeur précédente
1 janv. 1981
1.557 mds
+1.557 mds
0.0%
1 janv. 1982
1.421 mds
-135.756 mln.
-8.72%
1 janv. 1983
1.505 mds
+83.956 mln.
5.91%
1 janv. 1984
1.223 mds
-281.787 mln.
-18.72%
1 janv. 1985
1.139 mds
-84.184 mln.
-6.88%
1 janv. 1986
924.474 mln.
-214.801 mln.
-18.85%
1 janv. 1987
1.021 mds
+96.316 mln.
10.42%
1 janv. 1988
1.063 mds
+42.23 mln.
4.14%
1 janv. 1989
1.039 mds
-24.387 mln.
-2.29%
1 janv. 1990
1.149 mds
+110.517 mln.
10.64%
1 janv. 1991
1.075 mds
-74.388 mln.
-6.47%
1 janv. 1992
1.108 mds
+33.055 mln.
3.08%
1 janv. 1993
1.022 mds
-86.117 mln.
-7.77%
1 janv. 1994
1.03 mds
+8.151 mln.
0.8%
1 janv. 1995
1.279 mds
+249.266 mln.
24.2%
1 janv. 1996
1.255 mds
-23.818 mln.
-1.86%
1 janv. 1997
1.155 mds
-100.607 mln.
-8.01%
1 janv. 1998
1.159 mds
+4.217 mln.
0.37%
1 janv. 1999
1.247 mds
+88.447 mln.
7.63%
1 janv. 2000
1.764 mds
+517.057 mln.
41.45%
1 janv. 2001
1.715 mds
-49.043 mln.
-2.78%
1 janv. 2002
1.35 mds
-365.475 mln.
-21.31%
1 janv. 2003
2.762 mds
+1.412 mds
104.63%
1 janv. 2004
2.889 mds
+127.145 mln.
4.6%
1 janv. 2005
2.938 mds
+48.552 mln.
1.68%
1 janv. 2006
3.099 mds
+160.854 mln.
5.48%
1 janv. 2007
3.135 mds
+36.102 mln.
1.17%
1 janv. 2008
3.536 mds
+400.647 mln.
12.78%
1 janv. 2009
4.08 mds
+544.216 mln.
15.39%
1 janv. 2010
4.618 mds
+538.564 mln.
13.2%
1 janv. 2011
4.693 mds
+75.089 mln.
1.63%
1 janv. 2012
5.895 mds
+1.202 mds
25.6%
1 janv. 2013
9.574 mds
+3.678 mds
62.4%
1 janv. 2014
12.335 mds
+2.762 mds
28.85%
1 janv. 2015
14.131 mds
+1.795 mds
14.55%
1 janv. 2016
12.458 mds
-1.673 mds
-11.84%
Classement des pays selon les statistiques actuelles par années


Commentaires: