29
/fr/
fr
AIzaSyAYiBZKx7MnpbEhh9jyipgxe19OcubqV5w
April 1, 2024
202300
Morocco
MAR
true
2
1
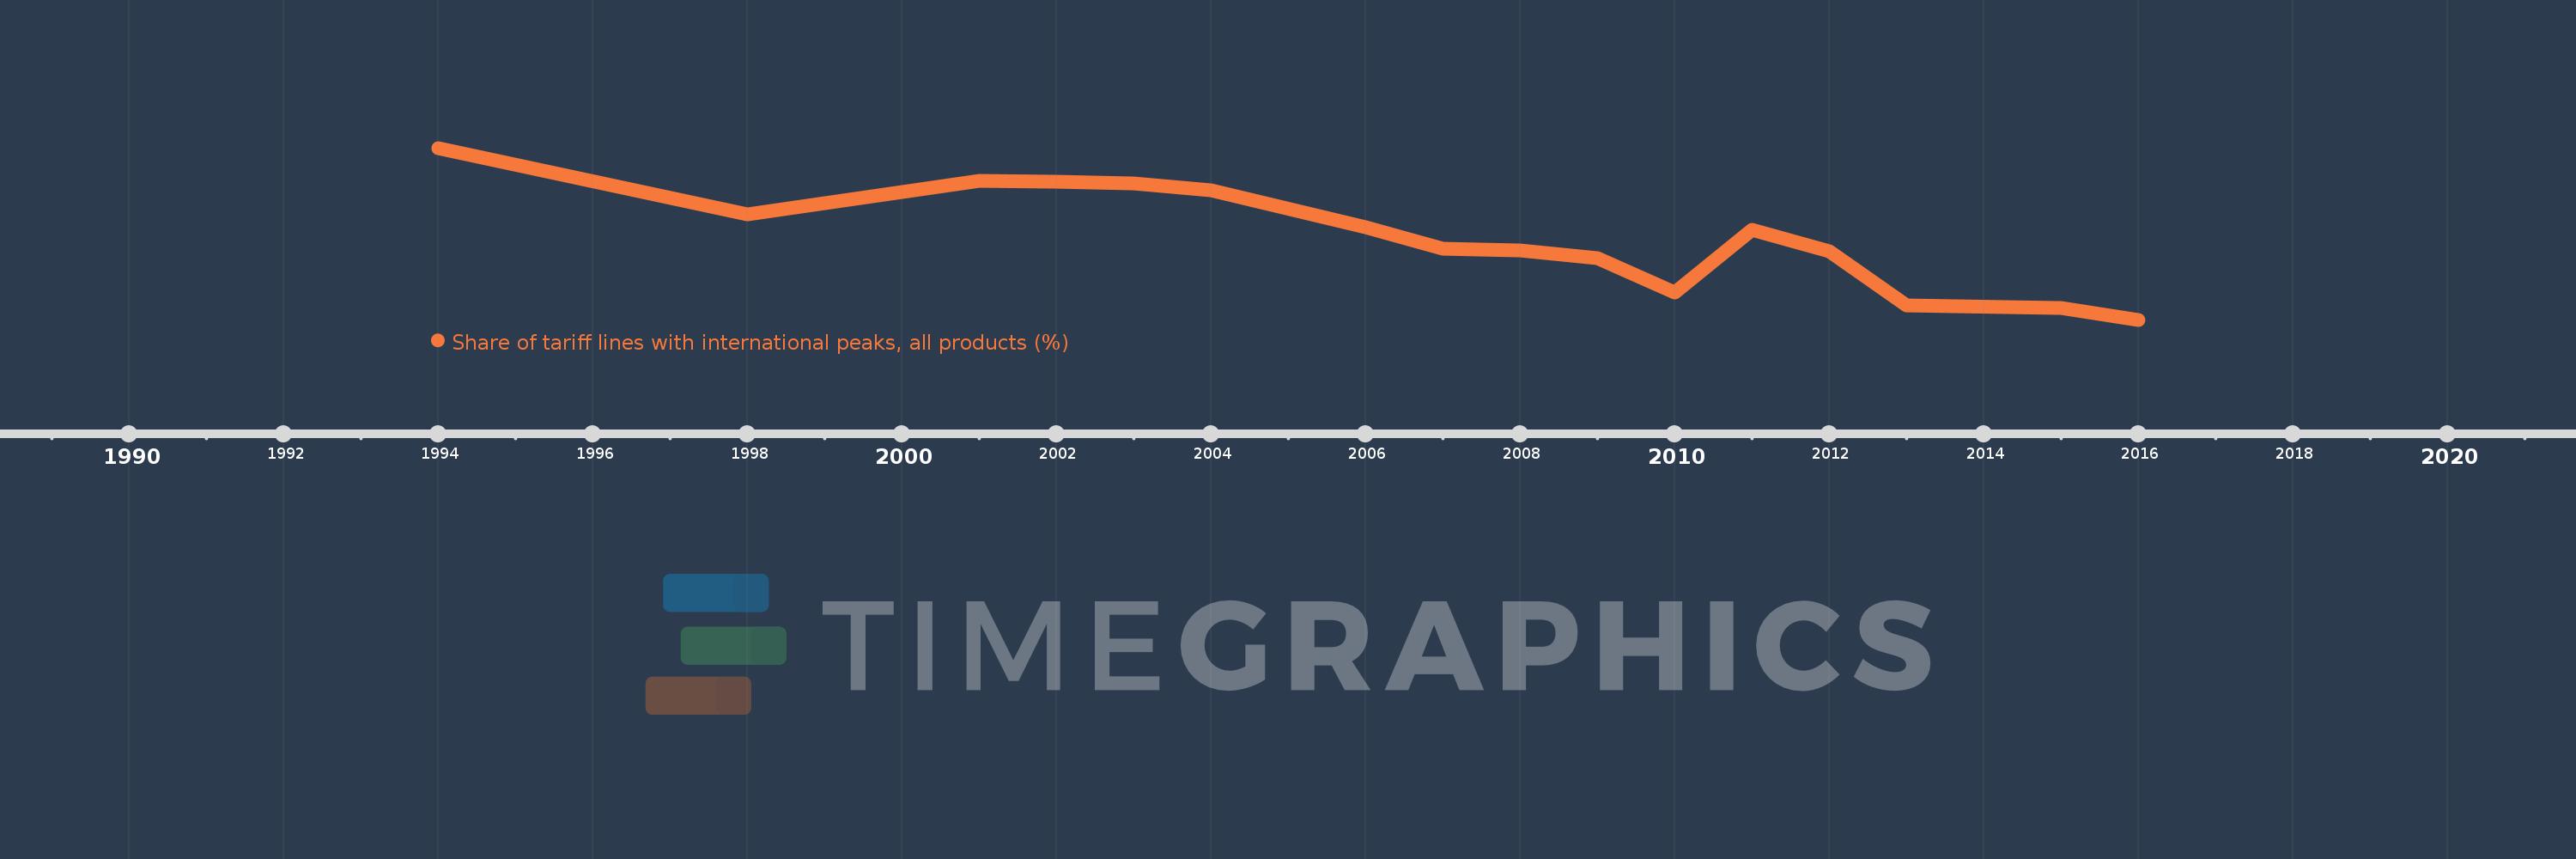
Share of tariff lines with international peaks, all products (%)
2016,2015,2013,2012,2011,2010,2009,2008,2007,2006,2004,2003,2002,2001,1998,1994
Cette statistique dans les autres pays:
AfghanistanAlbaniaAlgeriaAngolaAntigua and BarbudaArgentinaArmeniaArubaAustraliaAustriaAzerbaijanBahamas, TheBahrainBangladeshBarbadosBelarusBelgiumBelizeBeninBermudaBhutanBoliviaBosnia and HerzegovinaBotswanaBrazilBrunei DarussalamBulgariaBurkina FasoBurundiCabo VerdeCambodiaCameroonCanadaCentral African RepublicChadChileChinaColombiaComorosCongo, Dem. Rep.Congo, Rep.Costa RicaCote d'IvoireCroatiaCubaCyprusCzech RepublicDenmarkDjiboutiDominicaDominican RepublicEast Asia & Pacific (excluding high income)EcuadorEgypt, Arab Rep.El SalvadorEquatorial GuineaEritreaEstoniaEthiopiaEurope & Central Asia (excluding high income)European UnionFijiFinlandFranceFrench PolynesiaGabonGambia, TheGeorgiaGermanyGhanaGreeceGrenadaGuatemalaGuineaGuinea-BissauGuyanaHaitiHigh incomeHondurasHong Kong SAR, ChinaHungaryIcelandIndiaIndonesiaIran, Islamic Rep.IrelandIsraelItalyJamaicaJapanJordanKazakhstanKenyaKorea, Rep.KuwaitKyrgyz RepublicLao PDRLatin America & Caribbean (excluding high income)LatviaLebanonLesothoLiberiaLibyaLithuaniaLow & middle incomeLow incomeLower middle incomeLuxembourgMacao SAR, ChinaMacedonia, FYRMadagascarMalawiMalaysiaMaldivesMaliMaltaMauritaniaMauritiusMexicoMiddle East & North Africa (excluding high income)Middle incomeMoldovaMongoliaMontenegroMoroccoMozambiqueMyanmarNamibiaNepalNetherlandsNew ZealandNicaraguaNigerNigeriaNorwayOECD membersOmanPakistanPalauPanamaPapua New GuineaParaguayPeruPhilippinesPolandPortugalQatarRomaniaRussian FederationRwandaSamoaSaudi ArabiaSenegalSerbiaSeychellesSierra LeoneSingaporeSlovak RepublicSloveniaSolomon IslandsSouth AfricaSouth AsiaSpainSri LankaSt. Kitts and NevisSt. LuciaSt. Vincent and the GrenadinesSub-Saharan Africa (excluding high income)SudanSurinameSwazilandSwedenSwitzerlandSyrian Arab RepublicTajikistanTanzaniaThailandTimor-LesteTogoTongaTrinidad and TobagoTunisiaTurkeyTurkmenistanTuvaluUgandaUkraineUnited Arab EmiratesUnited KingdomUnited StatesUpper middle incomeUruguayUzbekistanVanuatuVenezuela, RBVietnamWorldYemen, Rep.ZambiaZimbabwe La ligne de temps
Cette échelle de temps montre un graphique de 1994 année à 2016 année Morocco. Les données jusqu'à 1993 année ne sont pas présentés. Quantité d'observations actuelles selon dates: 16.
Source (désignation):
Les indicateurs du développement mondiale
Source (organisation):
World Bank staff estimates using the World Integrated Trade Solution system, based on data from United Nations Conference on Trade and Development's Trade Analysis and Information System (TRAINS) database.
Catégories:
Private Sector, Trade
Dernière mise à jour
23 avr. 2017
Les indicateurs de changement de valeurs selon les années
Minimum:
9.968
1 janv. 2016
Maximum:
96.791
1 janv. 1994
Pour la date d''observation
Valeur
Changement absolu
Le changement par rapport à la valeur précédente
1 janv. 1994
96.791
+96.791
0.0%
1 janv. 1998
63.221
-33.57
-34.68%
1 janv. 2001
80.198
+16.978
26.86%
1 janv. 2002
79.938
-0.26
-0.32%
1 janv. 2003
79.019
-0.919
-1.15%
1 janv. 2004
75.367
-3.652
-4.62%
1 janv. 2006
56.721
-18.646
-24.74%
1 janv. 2007
45.718
-11.003
-19.4%
1 janv. 2008
45.133
-0.584
-1.28%
1 janv. 2009
41.146
-3.987
-8.83%
1 janv. 2010
23.581
-17.566
-42.69%
1 janv. 2011
55.632
+32.051
135.92%
1 janv. 2012
44.456
-11.177
-20.09%
1 janv. 2013
17.346
-27.11
-60.98%
1 janv. 2015
16.041
-1.305
-7.52%
1 janv. 2016
9.968
-6.073
-37.86%
Classement des pays selon les statistiques actuelles par années


Commentaires: