29
/fr/
fr
AIzaSyAYiBZKx7MnpbEhh9jyipgxe19OcubqV5w
April 1, 2024
202087
Morocco
MAR
true
2
1
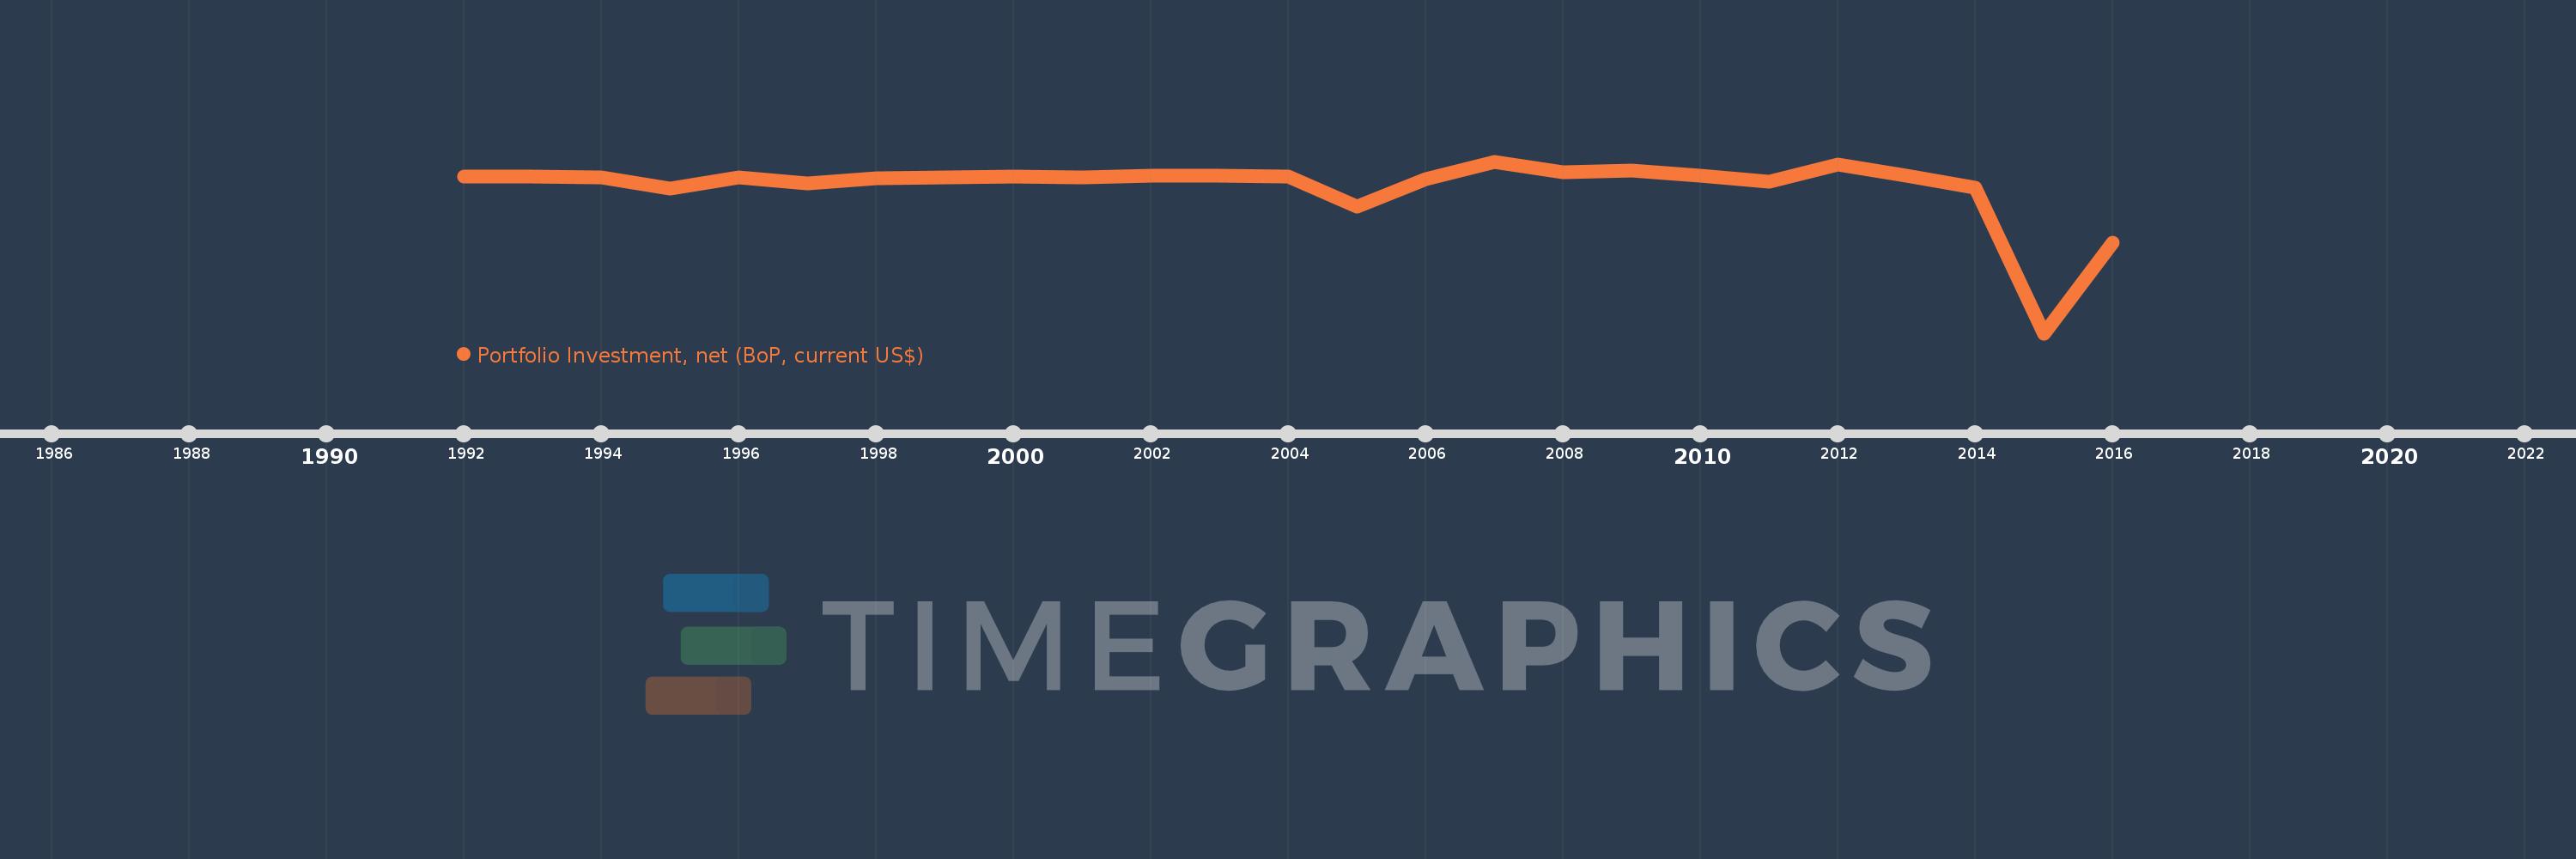
Portfolio Investment, net (BoP, current US$)
2016,2015,2014,2013,2012,2011,2010,2009,2008,2007,2006,2005,2004,2003,2002,2001,2000,1999,1998,1997,1996,1995,1994,1993,1992
Cette statistique dans les autres pays:
AfghanistanAlbaniaAlgeriaAngolaAntigua and BarbudaArgentinaArmeniaArubaAustraliaAustriaAzerbaijanBahamas, TheBahrainBangladeshBarbadosBelarusBelgiumBelizeBeninBermudaBoliviaBosnia and HerzegovinaBotswanaBrazilBrunei DarussalamBulgariaBurkina FasoBurundiCabo VerdeCambodiaCameroonCanadaChileChinaColombiaComorosCongo, Dem. Rep.Congo, Rep.Costa RicaCote d'IvoireCroatiaCuracaoCyprusCzech RepublicDenmarkDominicaDominican RepublicEcuadorEgypt, Arab Rep.El SalvadorEstoniaEuro areaFijiFinlandFranceFrench PolynesiaGabonGeorgiaGermanyGhanaGreeceGrenadaGuatemalaGuineaGuinea-BissauGuyanaHondurasHong Kong SAR, ChinaHungaryIcelandIndiaIndonesiaIraqIrelandIsraelItalyJamaicaJapanJordanKazakhstanKenyaKiribatiKorea, Rep.KosovoKuwaitKyrgyz RepublicLao PDRLatviaLebanonLesothoLiberiaLibyaLithuaniaLuxembourgMacao SAR, ChinaMacedonia, FYRMadagascarMalawiMalaysiaMaldivesMaliMaltaMarshall IslandsMauritaniaMauritiusMexicoMicronesia, Fed. Sts.MoldovaMongoliaMontenegroMoroccoMozambiqueMyanmarNamibiaNetherlandsNew CaledoniaNew ZealandNicaraguaNigerNigeriaNorwayOmanPakistanPalauPanamaPapua New GuineaParaguayPeruPhilippinesPolandPortugalQatarRomaniaRussian FederationRwandaSamoaSao Tome and PrincipeSaudi ArabiaSenegalSerbiaSeychellesSierra LeoneSingaporeSint Maarten (Dutch part)Slovak RepublicSloveniaSolomon IslandsSouth AfricaSpainSri LankaSt. Kitts and NevisSt. LuciaSt. Vincent and the GrenadinesSudanSurinameSwazilandSwedenSwitzerlandSyrian Arab RepublicTajikistanTanzaniaThailandTimor-LesteTogoTongaTrinidad and TobagoTunisiaTurkeyTuvaluUgandaUkraineUnited KingdomUnited StatesUruguayVanuatuVenezuela, RBVietnamWest Bank and GazaYemen, Rep.ZambiaZimbabwe La ligne de temps
Cette échelle de temps montre un graphique de 1992 année à 2016 année Morocco. Les données jusqu'à 1991 année ne sont pas présentés. Quantité d'observations actuelles selon dates: 25.
Source (désignation):
Les indicateurs du développement mondiale
Source (organisation):
International Monetary Fund, Balance of Payments Statistics Yearbook and data files.
Catégories:
Economy & Growth, Financial Sector
Dernière mise à jour
23 avr. 2017
Les indicateurs de changement de valeurs selon les années
Minimum:
-3.115 mds
1 janv. 2015
Maximum:
294.895 mln.
1 janv. 2007
Pour la date d''observation
Valeur
Changement absolu
Le changement par rapport à la valeur précédente
1 janv. 1992
-2.412 mln.
-2.412 mln.
0.0%
1 janv. 1993
-1.288 mln.
+1.124 mln.
-46.58%
1 janv. 1994
-24.197 mln.
-22.909 mln.
1.78 milles%
1 janv. 1995
-237.756 mln.
-213.559 mln.
882.59%
1 janv. 1996
-20.374 mln.
+217.382 mln.
-91.43%
1 janv. 1997
-141.81 mln.
-121.436 mln.
596.03%
1 janv. 1998
-37.682 mln.
+104.128 mln.
-73.43%
1 janv. 1999
-23.947 mln.
+13.735 mln.
-36.45%
1 janv. 2000
-6.018 mln.
+17.93 mln.
-74.87%
1 janv. 2001
-17.759 mln.
-11.741 mln.
195.11%
1 janv. 2002
6.998 mln.
+24.757 mln.
-139.41%
1 janv. 2003
7.622 mln.
+623.944 milles
8.92%
1 janv. 2004
-7.927 mln.
-15.549 mln.
-204.0%
1 janv. 2005
-596.831 mln.
-588.904 mln.
7.43 milles%
1 janv. 2006
-59.849 mln.
+536.982 mln.
-89.97%
1 janv. 2007
294.895 mln.
+354.744 mln.
-592.73%
1 janv. 2008
80.171 mln.
-214.724 mln.
-72.81%
1 janv. 2009
109.122 mln.
+28.952 mln.
36.11%
1 janv. 2010
16.596 mln.
-92.527 mln.
-84.79%
1 janv. 2011
-109.876 mln.
-126.471 mln.
-762.08%
1 janv. 2012
233.506 mln.
+343.382 mln.
-312.52%
1 janv. 2013
5.725 mln.
-227.781 mln.
-97.55%
1 janv. 2014
-221.288 mln.
-227.013 mln.
-3.97 milles%
1 janv. 2015
-3.115 mds
-2.894 mds
1.31 milles%
1 janv. 2016
-1.316 mds
+1.799 mds
-57.76%
Classement des pays selon les statistiques actuelles par années


Commentaires: