29
/fr/
fr
AIzaSyAYiBZKx7MnpbEhh9jyipgxe19OcubqV5w
April 1, 2024
201736
Morocco
MAR
true
2
1
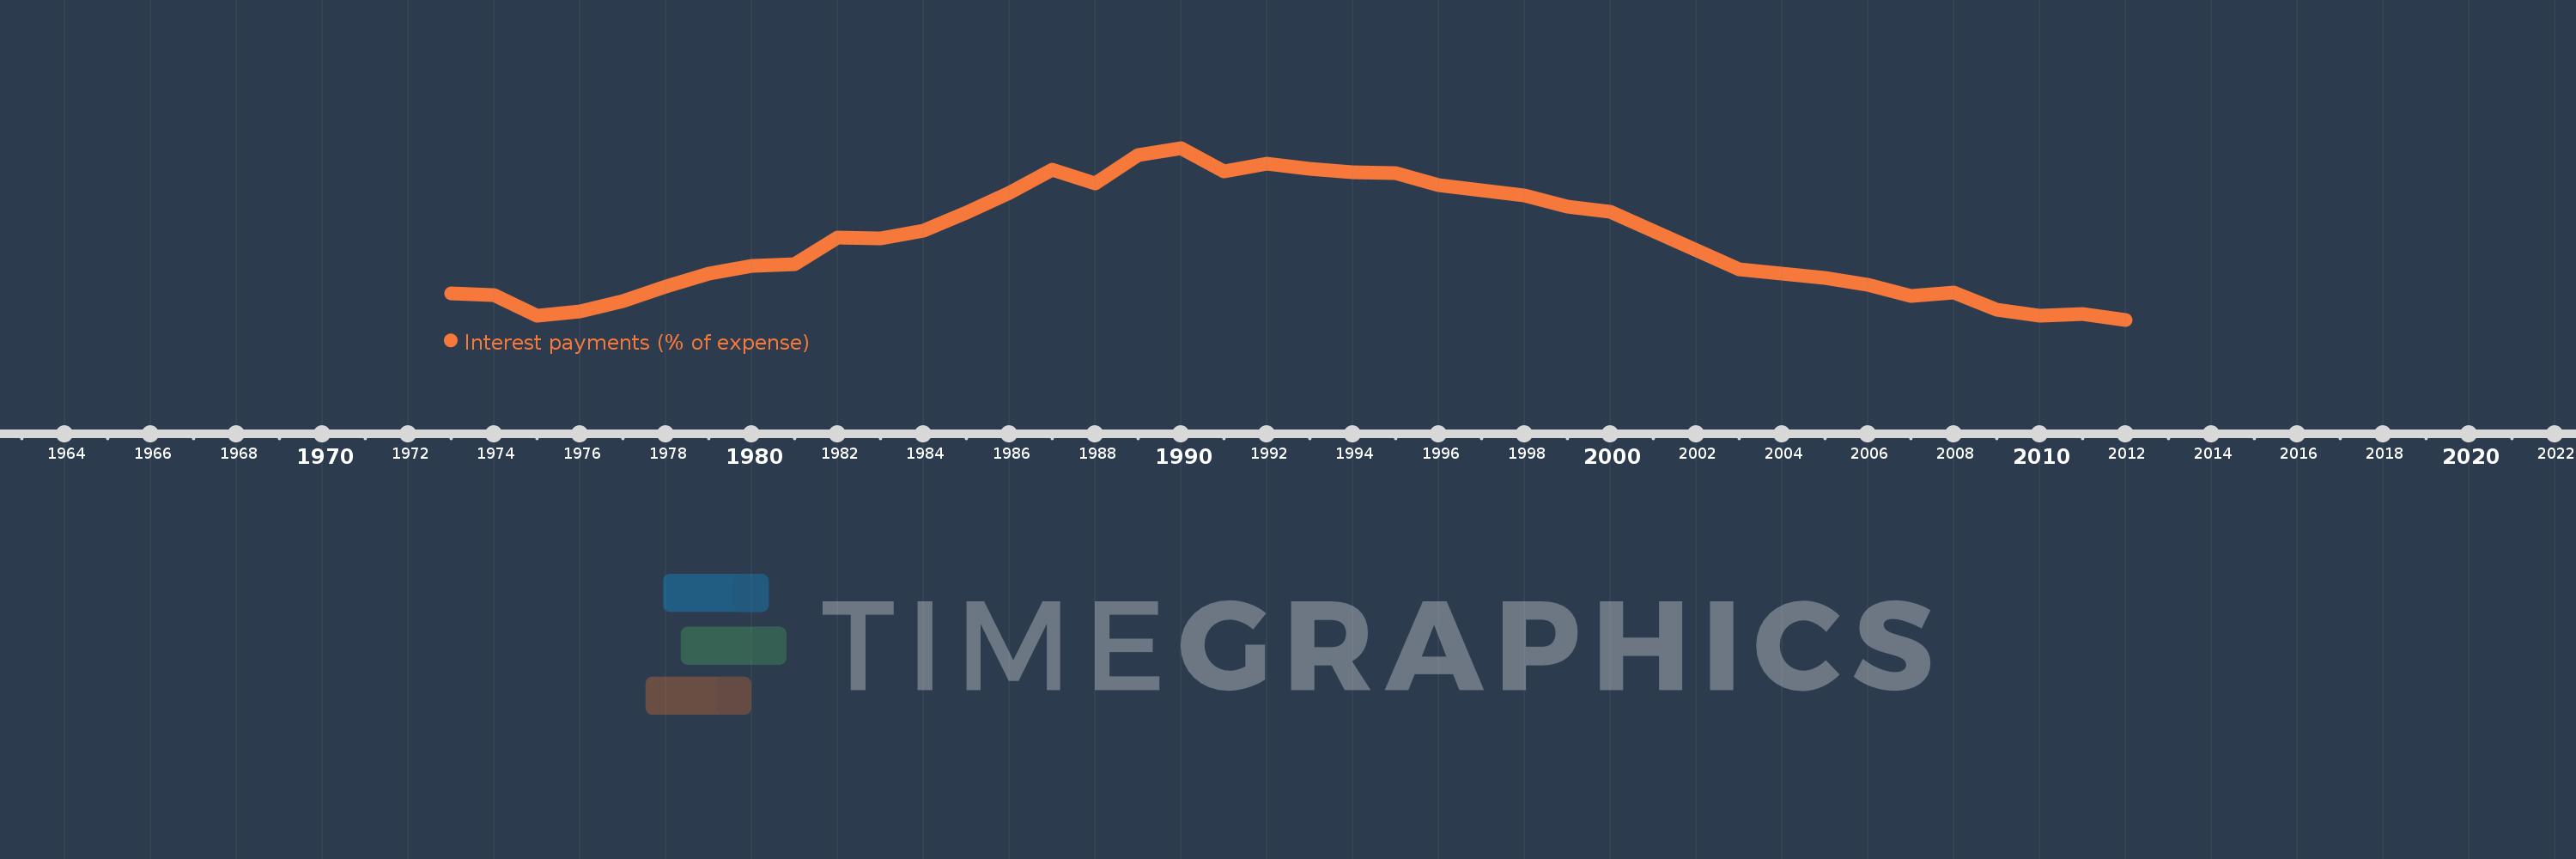
Interest payments (% of expense)
2012,2011,2010,2009,2008,2007,2006,2005,2004,2003,2000,1999,1998,1996,1995,1994,1993,1992,1991,1990,1989,1988,1987,1986,1985,1984,1983,1982,1981,1980,1979,1978,1977,1976,1975,1974,1973
Cette statistique dans les autres pays:
AfghanistanAlbaniaAlgeriaAngolaAntigua and BarbudaArab WorldArmeniaAustraliaAustriaAzerbaijanBahamas, TheBahrainBangladeshBarbadosBelarusBelgiumBelizeBeninBhutanBoliviaBosnia and HerzegovinaBotswanaBrazilBulgariaBurkina FasoBurundiCabo VerdeCambodiaCanadaCaribbean small statesCentral African RepublicCentral Europe and the BalticsChileColombiaCongo, Dem. Rep.Congo, Rep.Costa RicaCote d'IvoireCroatiaCyprusCzech RepublicDenmarkDominicaDominican RepublicEarly-demographic dividendEast Asia & PacificEast Asia & Pacific (excluding high income)East Asia & Pacific (IDA & IBRD countries)Egypt, Arab Rep.El SalvadorEquatorial GuineaEstoniaEthiopiaEuro areaEurope & Central AsiaEurope & Central Asia (excluding high income)Europe & Central Asia (IDA & IBRD countries)European UnionFijiFinlandFranceGambia, TheGeorgiaGermanyGhanaGreeceGrenadaGuatemalaHeavily indebted poor countries (HIPC)High incomeHondurasHong Kong SAR, ChinaHungaryIBRD onlyIcelandIDA & IBRD totalIDA blendIDA onlyIDA totalIndiaIndonesiaIran, Islamic Rep.IraqIrelandIsraelItalyJamaicaJapanJordanKazakhstanKenyaKiribatiKorea, Rep.KuwaitKyrgyz RepublicLao PDRLate-demographic dividendLatin America & Caribbean Latin America & Caribbean (excluding high income)Latin America & the Caribbean (IDA & IBRD countries)LatviaLeast developed countries: UN classificationLebanonLesothoLiberiaLithuaniaLow & middle incomeLow incomeLower middle incomeLuxembourgMacao SAR, ChinaMacedonia, FYRMadagascarMalawiMalaysiaMaldivesMaliMaltaMauritiusMexicoMicronesia, Fed. Sts.Middle East & North AfricaMiddle East & North Africa (excluding high income)Middle East & North Africa (IDA & IBRD countries)Middle incomeMoldovaMongoliaMoroccoMozambiqueNamibiaNepalNetherlandsNew ZealandNicaraguaNigeriaNorth AmericaNorwayOECD membersOmanOther small statesPakistanPanamaPapua New GuineaParaguayPeruPhilippinesPolandPortugalPost-demographic dividendPre-demographic dividendQatarRomaniaRussian FederationRwandaSamoaSan MarinoSao Tome and PrincipeSenegalSerbiaSeychellesSierra LeoneSingaporeSlovak RepublicSloveniaSmall statesSolomon IslandsSouth AfricaSouth AsiaSouth Asia (IDA & IBRD)SpainSri LankaSt. Kitts and NevisSt. LuciaSub-Saharan Africa Sub-Saharan Africa (excluding high income)Sub-Saharan Africa (IDA & IBRD countries)SurinameSwazilandSwedenSwitzerlandSyrian Arab RepublicTajikistanTanzaniaThailandTimor-LesteTogoTrinidad and TobagoTunisiaTurkeyUgandaUkraineUnited KingdomUnited StatesUpper middle incomeUruguayVanuatuVenezuela, RBVietnamWest Bank and GazaWorldYemen, Rep.ZambiaZimbabwe La ligne de temps
Cette échelle de temps montre un graphique de 1973 année à 2012 année Morocco. Les données jusqu'à 1972 année ne sont pas présentés. Quantité d'observations actuelles selon dates: 37.
Source (désignation):
Les indicateurs du développement mondiale
Source (organisation):
International Monetary Fund, Government Finance Statistics Yearbook and data files.
Catégories:
Public Sector
Dernière mise à jour
23 avr. 2017
Les indicateurs de changement de valeurs selon les années
Minimum:
3.174
1 janv. 2012
Maximum:
25.407
1 janv. 1990
Pour la date d''observation
Valeur
Changement absolu
Le changement par rapport à la valeur précédente
1 janv. 1973
6.534
+6.534
0.0%
1 janv. 1974
6.338
-0.195
-2.99%
1 janv. 1975
3.749
-2.59
-40.86%
1 janv. 1976
4.262
+0.514
13.7%
1 janv. 1977
5.588
+1.325
31.1%
1 janv. 1978
7.486
+1.898
33.97%
1 janv. 1979
9.116
+1.63
21.78%
1 janv. 1980
10.103
+0.986
10.82%
1 janv. 1981
10.368
+0.266
2.63%
1 janv. 1982
13.8
+3.432
33.1%
1 janv. 1983
13.682
-0.118
-0.85%
1 janv. 1984
14.676
+0.994
7.27%
1 janv. 1985
16.983
+2.307
15.72%
1 janv. 1986
19.636
+2.653
15.62%
1 janv. 1987
22.584
+2.948
15.01%
1 janv. 1988
20.799
-1.784
-7.9%
1 janv. 1989
24.504
+3.704
17.81%
1 janv. 1990
25.407
+0.903
3.68%
1 janv. 1991
22.393
-3.014
-11.86%
1 janv. 1992
23.388
+0.995
4.45%
1 janv. 1993
22.748
-0.64
-2.74%
1 janv. 1994
22.24
-0.508
-2.23%
1 janv. 1995
22.121
-0.118
-0.53%
1 janv. 1996
20.542
-1.579
-7.14%
1 janv. 1998
19.244
-1.298
-6.32%
1 janv. 1999
17.803
-1.442
-7.49%
1 janv. 2000
17.151
-0.651
-3.66%
1 janv. 2003
9.711
-7.44
-43.38%
1 janv. 2004
9.198
-0.513
-5.28%
1 janv. 2005
8.601
-0.597
-6.49%
1 janv. 2006
7.752
-0.849
-9.87%
1 janv. 2007
6.298
-1.453
-18.75%
1 janv. 2008
6.721
+0.423
6.72%
1 janv. 2009
4.464
-2.257
-33.59%
1 janv. 2010
3.735
-0.729
-16.32%
1 janv. 2011
3.969
+0.234
6.25%
1 janv. 2012
3.174
-0.794
-20.01%
Classement des pays selon les statistiques actuelles par années


Commentaires: