29
/fr/
fr
AIzaSyAYiBZKx7MnpbEhh9jyipgxe19OcubqV5w
April 1, 2024
201426
Morocco
MAR
true
2
1
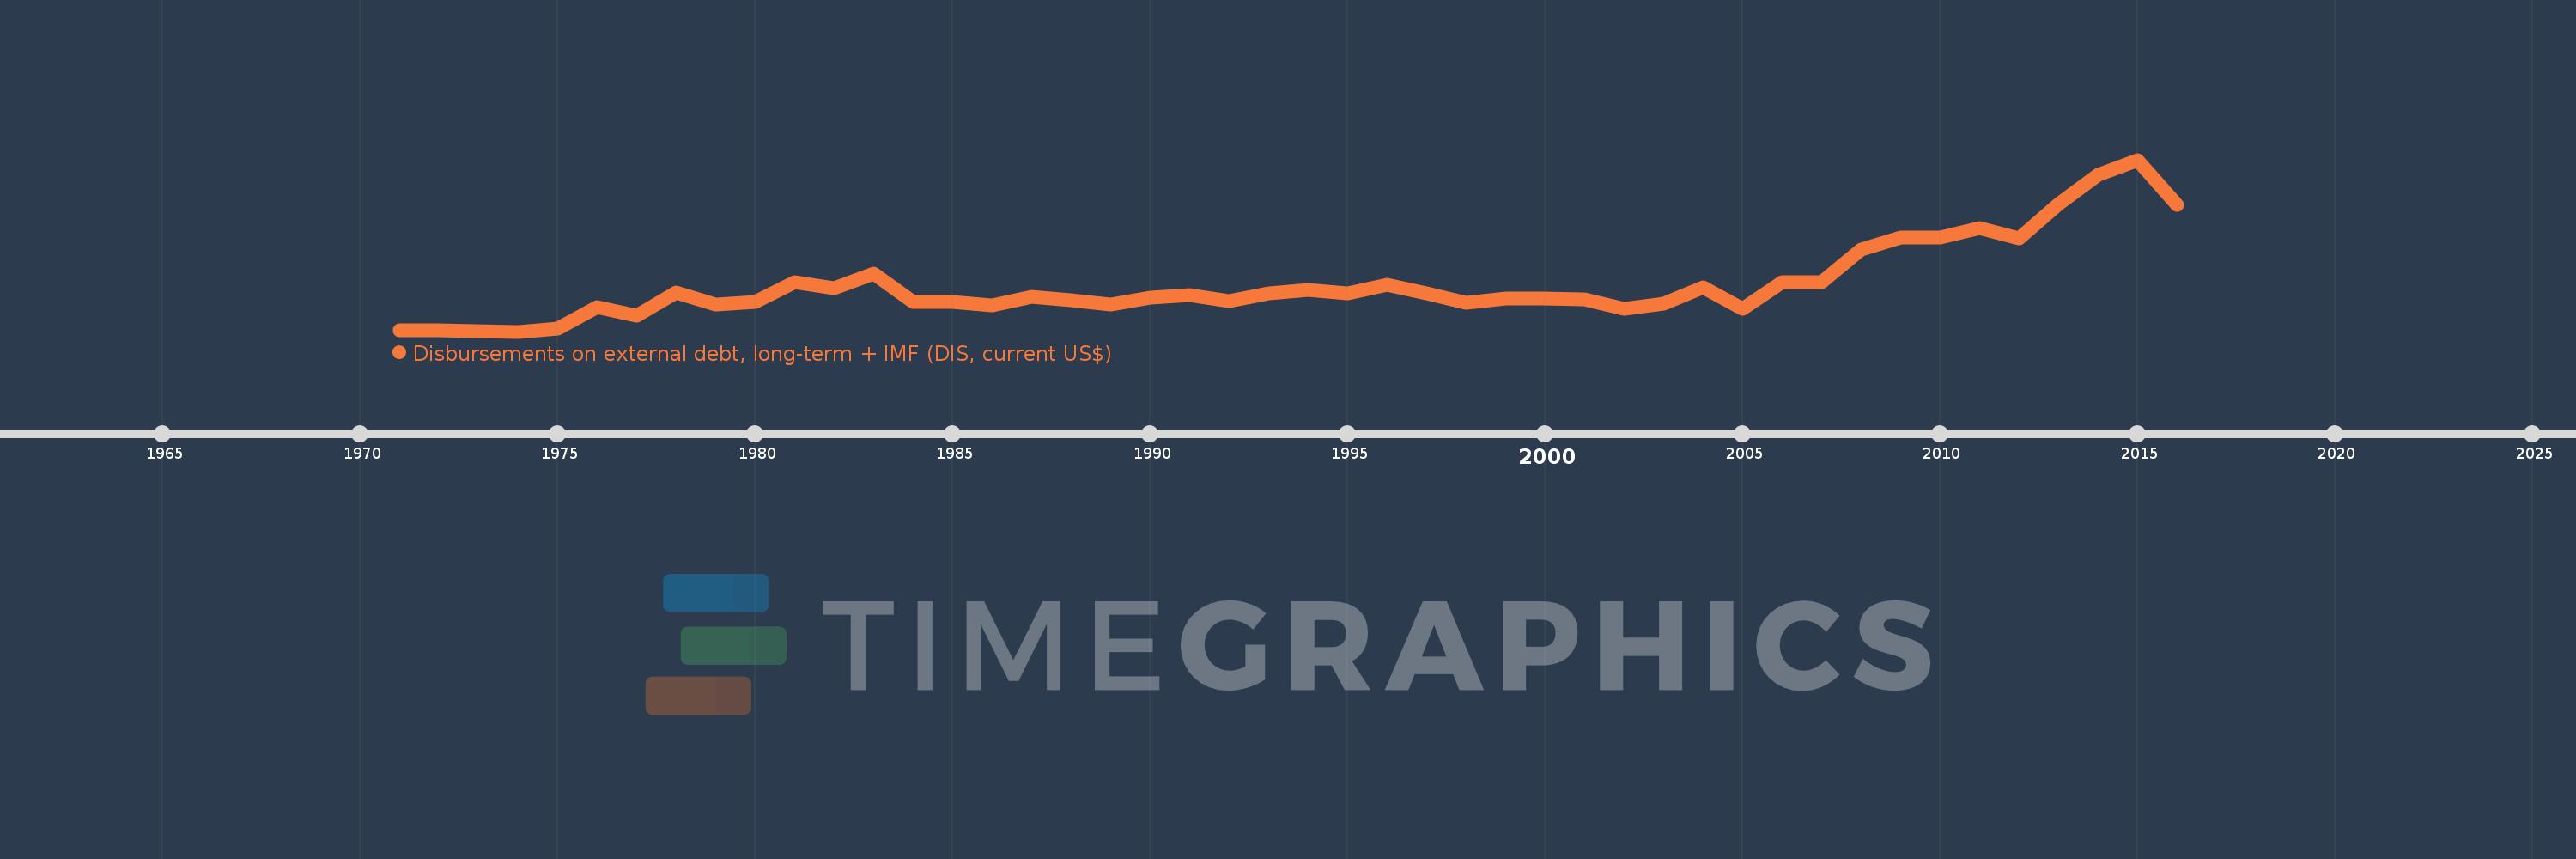
Disbursements on external debt, long-term + IMF (DIS, current US$)
2016,2015,2014,2013,2012,2011,2010,2009,2008,2007,2006,2005,2004,2003,2002,2001,2000,1999,1998,1997,1996,1995,1994,1993,1992,1991,1990,1989,1988,1987,1986,1985,1984,1983,1982,1981,1980,1979,1978,1977,1976,1975,1974,1973,1972,1971
Cette statistique dans les autres pays:
La ligne de temps
Cette échelle de temps montre un graphique de 1971 année à 2016 année Morocco. Les données jusqu'à 1970 année ne sont pas présentés. Quantité d'observations actuelles selon dates: 46.
Source (désignation):
Les indicateurs du développement mondiale
Source (organisation):
World Bank, International Debt Statistics.
Catégories:
External Debt
Dernière mise à jour
23 avr. 2017
Les indicateurs de changement de valeurs selon les années
Minimum:
122.902 mln.
1 janv. 1974
Maximum:
8.2 mds
1 janv. 2015
Pour la date d''observation
Valeur
Changement absolu
Le changement par rapport à la valeur précédente
1 janv. 1971
196.21 mln.
+196.21 mln.
0.0%
1 janv. 1972
194.188 mln.
-2.022 mln.
-1.03%
1 janv. 1973
132.389 mln.
-61.799 mln.
-31.82%
1 janv. 1974
122.902 mln.
-9.487 mln.
-7.17%
1 janv. 1975
269.031 mln.
+146.129 mln.
118.9%
1 janv. 1976
1.273 mds
+1.004 mds
373.13%
1 janv. 1977
889.95 mln.
-382.929 mln.
-30.08%
1 janv. 1978
1.956 mds
+1.066 mds
119.8%
1 janv. 1979
1.402 mds
-553.838 mln.
-28.31%
1 janv. 1980
1.497 mds
+95.073 mln.
6.78%
1 janv. 1981
2.452 mds
+954.559 mln.
63.75%
1 janv. 1982
2.175 mds
-276.375 mln.
-11.27%
1 janv. 1983
2.869 mds
+693.628 mln.
31.88%
1 janv. 1984
1.501 mds
-1.368 mds
-47.67%
1 janv. 1985
1.518 mds
+16.6 mln.
1.11%
1 janv. 1986
1.347 mds
-170.757 mln.
-11.25%
1 janv. 1987
1.753 mds
+406.283 mln.
30.16%
1 janv. 1988
1.577 mds
-176.409 mln.
-10.06%
1 janv. 1989
1.404 mds
-173.466 mln.
-11.0%
1 janv. 1990
1.7 mds
+296.666 mln.
21.14%
1 janv. 1991
1.853 mds
+153.272 mln.
9.01%
1 janv. 1992
1.546 mds
-307.685 mln.
-16.6%
1 janv. 1993
1.938 mds
+392.665 mln.
25.4%
1 janv. 1994
2.102 mds
+163.338 mln.
8.43%
1 janv. 1995
1.908 mds
-193.974 mln.
-9.23%
1 janv. 1996
2.309 mds
+401.064 mln.
21.02%
1 janv. 1997
1.929 mds
-379.824 mln.
-16.45%
1 janv. 1998
1.472 mds
-457.016 mln.
-23.69%
1 janv. 1999
1.683 mds
+210.916 mln.
14.33%
1 janv. 2000
1.695 mds
+11.667 mln.
0.69%
1 janv. 2001
1.638 mds
-56.3 mln.
-3.32%
1 janv. 2002
1.189 mds
-449.013 mln.
-27.41%
1 janv. 2003
1.447 mds
+257.449 mln.
21.65%
1 janv. 2004
2.219 mds
+772.095 mln.
53.37%
1 janv. 2005
1.203 mds
-1.016 mds
-45.8%
1 janv. 2006
2.456 mds
+1.253 mds
104.22%
1 janv. 2007
2.426 mds
-30.188 mln.
-1.23%
1 janv. 2008
3.976 mds
+1.55 mds
63.9%
1 janv. 2009
4.554 mds
+578.116 mln.
14.54%
1 janv. 2010
4.551 mds
-2.378 mln.
-0.05%
1 janv. 2011
4.999 mds
+447.466 mln.
9.83%
1 janv. 2012
4.506 mds
-492.685 mln.
-9.86%
1 janv. 2013
6.122 mds
+1.616 mds
35.86%
1 janv. 2014
7.486 mds
+1.364 mds
22.29%
1 janv. 2015
8.2 mds
+713.93 mln.
9.54%
1 janv. 2016
6.062 mds
-2.138 mds
-26.07%
Classement des pays selon les statistiques actuelles par années


Commentaires: