29
/fr/
fr
AIzaSyAYiBZKx7MnpbEhh9jyipgxe19OcubqV5w
April 1, 2024
199526
Mongolia
MNG
true
2
1
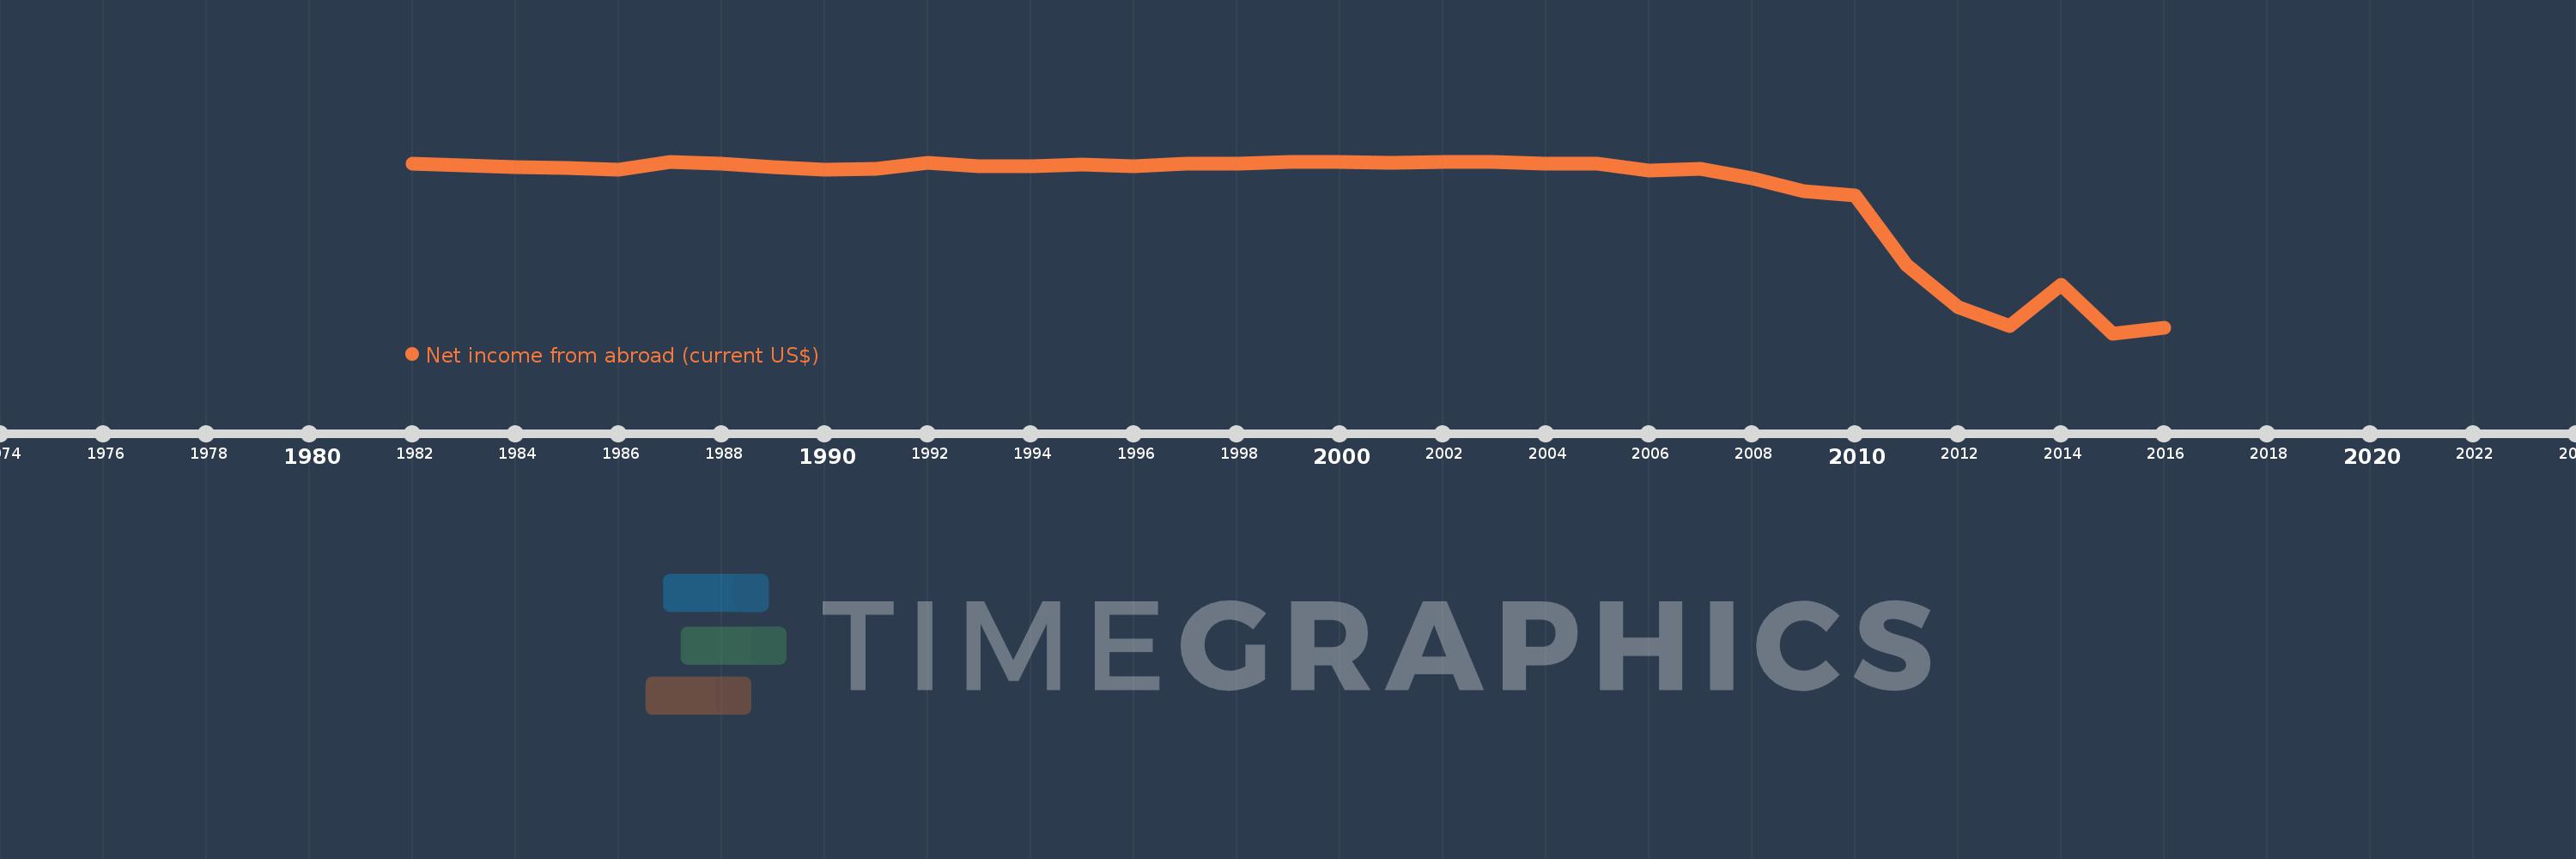
Net income from abroad (current US$)
2016,2015,2014,2013,2012,2011,2010,2009,2008,2007,2006,2005,2004,2003,2002,2001,2000,1999,1998,1997,1996,1995,1994,1993,1992,1991,1990,1989,1988,1987,1986,1985,1984,1983,1982
Cette statistique dans les autres pays:
AfghanistanAlbaniaAlgeriaAndorraAngolaAntigua and BarbudaArgentinaArmeniaAustraliaAustriaAzerbaijanBahamas, TheBahrainBangladeshBarbadosBelarusBelgiumBelizeBeninBermudaBhutanBoliviaBosnia and HerzegovinaBotswanaBrazilBrunei DarussalamBulgariaBurkina FasoBurundiCabo VerdeCambodiaCameroonCanadaCentral African RepublicChadChannel IslandsChileChinaColombiaComorosCongo, Dem. Rep.Congo, Rep.Costa RicaCote d'IvoireCroatiaCubaCyprusCzech RepublicDenmarkDjiboutiDominicaDominican RepublicEcuadorEgypt, Arab Rep.El SalvadorEquatorial GuineaEritreaEstoniaEthiopiaFaroe IslandsFijiFinlandFranceFrench PolynesiaGabonGambia, TheGeorgiaGermanyGhanaGreeceGreenlandGrenadaGuatemalaGuineaGuinea-BissauGuyanaHaitiHondurasHong Kong SAR, ChinaHungaryIcelandIndiaIndonesiaIran, Islamic Rep.IraqIrelandIsraelItalyJamaicaJapanJordanKazakhstanKenyaKiribatiKorea, Rep.KosovoKuwaitKyrgyz RepublicLao PDRLatviaLebanonLesothoLiberiaLibyaLithuaniaLuxembourgMacao SAR, ChinaMacedonia, FYRMadagascarMalawiMalaysiaMaldivesMaliMaltaMarshall IslandsMauritaniaMauritiusMexicoMicronesia, Fed. Sts.MoldovaMonacoMongoliaMontenegroMoroccoMozambiqueMyanmarNamibiaNepalNetherlandsNew CaledoniaNew ZealandNicaraguaNigerNigeriaNorwayOmanPakistanPalauPanamaPapua New GuineaParaguayPeruPhilippinesPolandPortugalPuerto RicoQatarRomaniaRussian FederationRwandaSamoaSao Tome and PrincipeSaudi ArabiaSenegalSerbiaSeychellesSierra LeoneSingaporeSlovak RepublicSloveniaSolomon IslandsSomaliaSouth AfricaSouth SudanSpainSri LankaSt. Kitts and NevisSt. LuciaSt. Vincent and the GrenadinesSudanSurinameSwazilandSwedenSwitzerlandSyrian Arab RepublicTajikistanTanzaniaThailandTimor-LesteTogoTongaTrinidad and TobagoTunisiaTurkeyTurkmenistanTuvaluUgandaUkraineUnited Arab EmiratesUnited KingdomUnited StatesUruguayUzbekistanVanuatuVenezuela, RBVietnamVirgin Islands (U.S.)West Bank and GazaYemen, Rep.ZambiaZimbabwe La ligne de temps
Cette échelle de temps montre un graphique de 1982 année à 2016 année Mongolia. Les données jusqu'à 1981 année ne sont pas présentés. Quantité d'observations actuelles selon dates: 35.
Source (désignation):
Les indicateurs du développement mondiale
Source (organisation):
World Bank national accounts data, and OECD National Accounts data files.
Catégories:
Economy & Growth
Dernière mise à jour
23 avr. 2017
Les indicateurs de changement de valeurs selon les années
Minimum:
-993.972 mln.
1 janv. 2015
Maximum:
399.655 milles
1 janv. 1999
Pour la date d''observation
Valeur
Changement absolu
Le changement par rapport à la valeur précédente
1 janv. 1982
-10.9 mln.
-10.9 mln.
0.0%
1 janv. 1983
-20.4 mln.
-9.5 mln.
87.16%
1 janv. 1984
-31.1 mln.
-10.7 mln.
52.45%
1 janv. 1985
-39.0 mln.
-7.9 mln.
25.4%
1 janv. 1986
-45.0 mln.
-6.0 mln.
15.38%
1 janv. 1987
-1.7 mln.
+43.3 mln.
-96.22%
1 janv. 1988
-11.3 mln.
-9.6 mln.
564.71%
1 janv. 1989
-34.2 mln.
-22.9 mln.
202.65%
1 janv. 1990
-48.9 mln.
-14.7 mln.
42.98%
1 janv. 1991
-43.6 mln.
+5.3 mln.
-10.84%
1 janv. 1992
-4.91 mln.
+38.69 mln.
-88.74%
1 janv. 1993
-26.9 mln.
-21.99 mln.
447.83%
1 janv. 1994
-26.931 mln.
-30.834 milles
0.11%
1 janv. 1995
-19.413 mln.
+7.518 mln.
-27.91%
1 janv. 1996
-26.808 mln.
-7.395 mln.
38.09%
1 janv. 1997
-14.36 mln.
+12.449 mln.
-46.44%
1 janv. 1998
-11.996 mln.
+2.364 mln.
-16.46%
1 janv. 1999
399.655 milles
+12.396 mln.
-103.33%
1 janv. 2000
99.992 milles
-299.663 milles
-74.98%
1 janv. 2001
-5.199 mln.
-5.299 mln.
-5.3 milles%
1 janv. 2002
-2.009 mln.
+3.19 mln.
-61.36%
1 janv. 2003
-4.5 mln.
-2.491 mln.
124.02%
1 janv. 2004
-11.5 mln.
-7.0 mln.
155.56%
1 janv. 2005
-11.057 mln.
+443.025 milles
-3.85%
1 janv. 2006
-51.79 mln.
-40.733 mln.
368.39%
1 janv. 2007
-42.665 mln.
+9.126 mln.
-17.62%
1 janv. 2008
-97.542 mln.
-54.877 mln.
128.63%
1 janv. 2009
-173.259 mln.
-75.717 mln.
77.63%
1 janv. 2010
-195.836 mln.
-22.577 mln.
13.03%
1 janv. 2011
-598.347 mln.
-402.511 mln.
205.53%
1 janv. 2012
-843.316 mln.
-244.968 mln.
40.94%
1 janv. 2013
-949.369 mln.
-106.053 mln.
12.58%
1 janv. 2014
-710.609 mln.
+238.76 mln.
-25.15%
1 janv. 2015
-993.972 mln.
-283.363 mln.
39.88%
1 janv. 2016
-963.785 mln.
+30.187 mln.
-3.04%
Classement des pays selon les statistiques actuelles par années


Commentaires: