29
/fr/
fr
AIzaSyAYiBZKx7MnpbEhh9jyipgxe19OcubqV5w
April 1, 2024
196002
Mexico
MEX
true
2
1
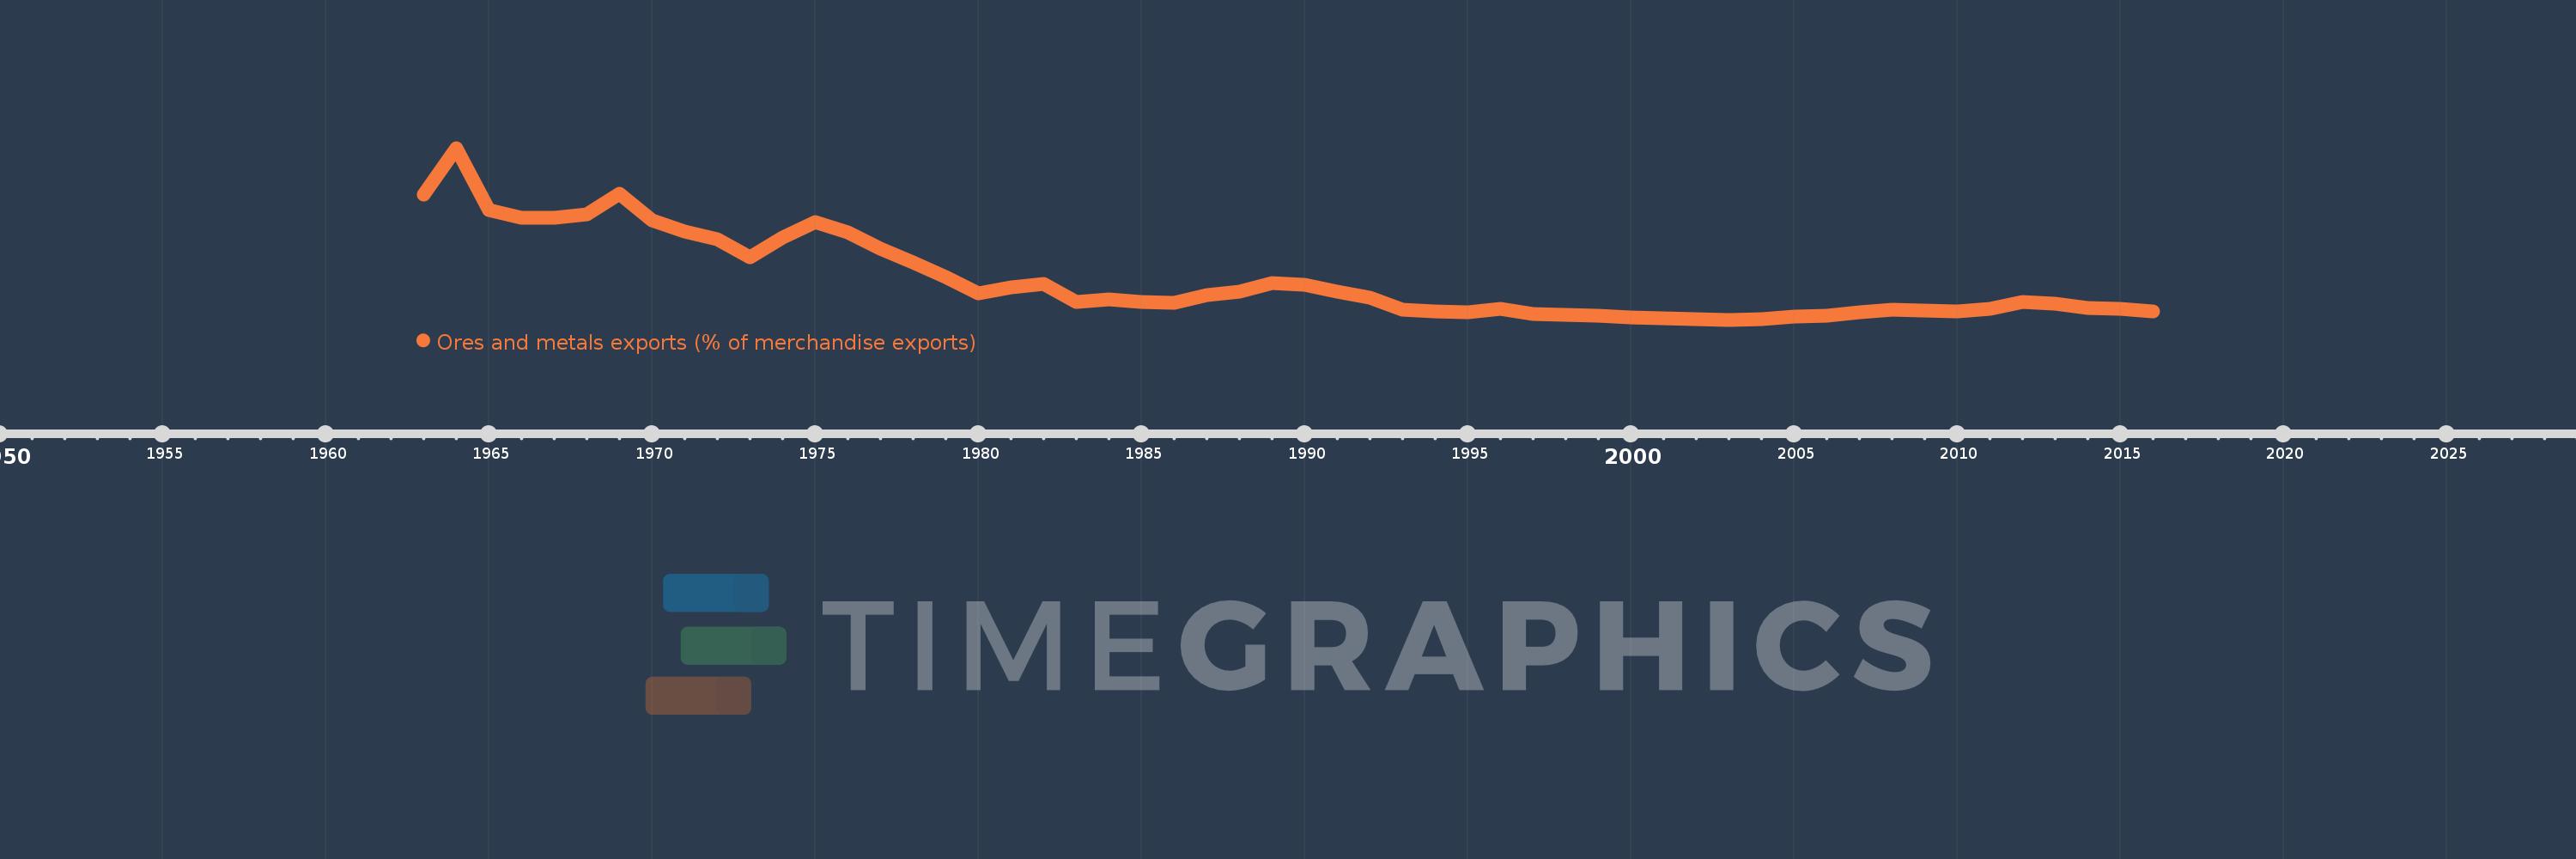
Ores and metals exports (% of merchandise exports)
2016,2015,2014,2013,2012,2011,2010,2009,2008,2007,2006,2005,2004,2003,2002,2001,2000,1999,1998,1997,1996,1995,1994,1993,1992,1991,1990,1989,1988,1987,1986,1985,1984,1983,1982,1981,1980,1979,1978,1977,1976,1975,1974,1973,1972,1971,1970,1969,1968,1967,1966,1965,1964,1963
Cette statistique dans les autres pays:
AfghanistanAlbaniaAlgeriaAndorraAngolaAntigua and BarbudaArab WorldArgentinaArmeniaArubaAustraliaAustriaAzerbaijanBahamas, TheBahrainBangladeshBarbadosBelarusBelgiumBelizeBeninBermudaBhutanBoliviaBosnia and HerzegovinaBotswanaBrazilBrunei DarussalamBulgariaBurkina FasoBurundiCabo VerdeCambodiaCameroonCanadaCaribbean small statesCayman IslandsCentral African RepublicCentral Europe and the BalticsChadChileChinaColombiaComorosCongo, Dem. Rep.Congo, Rep.Costa RicaCote d'IvoireCroatiaCubaCyprusCzech RepublicDenmarkDjiboutiDominicaDominican RepublicEarly-demographic dividendEast Asia & PacificEast Asia & Pacific (excluding high income)East Asia & Pacific (IDA & IBRD countries)EcuadorEgypt, Arab Rep.El SalvadorEquatorial GuineaEritreaEstoniaEthiopiaEuro areaEurope & Central AsiaEurope & Central Asia (excluding high income)Europe & Central Asia (IDA & IBRD countries)European UnionFaroe IslandsFijiFinlandFragile and conflict affected situationsFranceFrench PolynesiaGabonGambia, TheGeorgiaGermanyGhanaGreeceGreenlandGrenadaGuatemalaGuineaGuinea-BissauGuyanaHaitiHeavily indebted poor countries (HIPC)High incomeHondurasHong Kong SAR, ChinaHungaryIBRD onlyIcelandIDA & IBRD totalIDA blendIDA onlyIDA totalIndiaIndonesiaIran, Islamic Rep.IraqIrelandIsraelItalyJamaicaJapanJordanKazakhstanKenyaKiribatiKorea, Rep.KuwaitKyrgyz RepublicLao PDRLate-demographic dividendLatin America & Caribbean Latin America & Caribbean (excluding high income)Latin America & the Caribbean (IDA & IBRD countries)LatviaLeast developed countries: UN classificationLebanonLesothoLiberiaLibyaLithuaniaLow & middle incomeLower middle incomeLuxembourgMacao SAR, ChinaMacedonia, FYRMadagascarMalawiMalaysiaMaldivesMaliMaltaMauritaniaMauritiusMexicoMiddle East & North AfricaMiddle East & North Africa (excluding high income)Middle East & North Africa (IDA & IBRD countries)Middle incomeMoldovaMongoliaMoroccoMozambiqueMyanmarNamibiaNepalNetherlandsNew CaledoniaNew ZealandNicaraguaNigerNigeriaNorth AmericaNorwayOECD membersOmanOther small statesPacific island small statesPakistanPalauPanamaPapua New GuineaParaguayPeruPhilippinesPolandPortugalPost-demographic dividendPre-demographic dividendQatarRomaniaRussian FederationRwandaSamoaSao Tome and PrincipeSaudi ArabiaSenegalSerbiaSeychellesSierra LeoneSingaporeSlovak RepublicSloveniaSmall statesSolomon IslandsSomaliaSouth AfricaSouth AsiaSouth Asia (IDA & IBRD)SpainSri LankaSt. Kitts and NevisSt. LuciaSt. Vincent and the GrenadinesSub-Saharan Africa Sub-Saharan Africa (excluding high income)Sub-Saharan Africa (IDA & IBRD countries)SudanSurinameSwazilandSwedenSwitzerlandSyrian Arab RepublicTajikistanTanzaniaThailandTimor-LesteTogoTongaTrinidad and TobagoTunisiaTurkeyTurkmenistanTurks and Caicos IslandsUgandaUkraineUnited Arab EmiratesUnited KingdomUnited StatesUpper middle incomeUruguayVanuatuVenezuela, RBVietnamVirgin Islands (U.S.)WorldYemen, Rep.ZambiaZimbabwe La ligne de temps
Cette échelle de temps montre un graphique de 1963 année à 2016 année Mexico. Les données jusqu'à 1962 année ne sont pas présentés. Quantité d'observations actuelles selon dates: 54.
Source (désignation):
Les indicateurs du développement mondiale
Source (organisation):
World Bank staff estimates from the Comtrade database maintained by the United Nations Statistics Division.
Catégories:
Energy & Mining, Private Sector, Trade
Dernière mise à jour
23 avr. 2017
Les indicateurs de changement de valeurs selon les années
Minimum:
1.156
1 janv. 2003
Maximum:
29.109
1 janv. 1964
Pour la date d''observation
Valeur
Changement absolu
Le changement par rapport à la valeur précédente
1 janv. 1963
21.49
+21.49
0.0%
1 janv. 1964
29.109
+7.619
35.45%
1 janv. 1965
18.944
-10.165
-34.92%
1 janv. 1966
17.762
-1.182
-6.24%
1 janv. 1967
17.706
-0.055
-0.31%
1 janv. 1968
18.236
+0.53
2.99%
1 janv. 1969
21.658
+3.422
18.77%
1 janv. 1970
17.292
-4.366
-20.16%
1 janv. 1971
15.531
-1.761
-10.18%
1 janv. 1972
14.264
-1.268
-8.16%
1 janv. 1973
11.366
-2.897
-20.31%
1 janv. 1974
14.49
+3.123
27.48%
1 janv. 1975
17.084
+2.594
17.91%
1 janv. 1976
15.328
-1.756
-10.28%
1 janv. 1977
12.735
-2.592
-16.91%
1 janv. 1978
10.499
-2.237
-17.56%
1 janv. 1979
8.086
-2.413
-22.98%
1 janv. 1980
5.458
-2.627
-32.49%
1 janv. 1981
6.469
+1.01
18.51%
1 janv. 1982
7.034
+0.565
8.74%
1 janv. 1983
4.11
-2.924
-41.57%
1 janv. 1984
4.458
+0.347
8.45%
1 janv. 1985
4.029
-0.429
-9.62%
1 janv. 1986
3.849
-0.179
-4.45%
1 janv. 1987
5.131
+1.282
33.31%
1 janv. 1988
5.793
+0.662
12.9%
1 janv. 1989
7.131
+1.338
23.1%
1 janv. 1990
6.854
-0.277
-3.88%
1 janv. 1991
5.696
-1.158
-16.89%
1 janv. 1992
4.769
-0.927
-16.28%
1 janv. 1993
2.843
-1.926
-40.39%
1 janv. 1994
2.548
-0.295
-10.38%
1 janv. 1995
2.342
-0.206
-8.07%
1 janv. 1996
2.884
+0.542
23.14%
1 janv. 1997
2.036
-0.849
-29.43%
1 janv. 1998
1.89
-0.146
-7.16%
1 janv. 1999
1.76
-0.13
-6.89%
1 janv. 2000
1.472
-0.288
-16.37%
1 janv. 2001
1.335
-0.137
-9.28%
1 janv. 2002
1.257
-0.078
-5.88%
1 janv. 2003
1.156
-0.1
-7.96%
1 janv. 2004
1.231
+0.074
6.44%
1 janv. 2005
1.644
+0.413
33.52%
1 janv. 2006
1.831
+0.188
11.43%
1 janv. 2007
2.384
+0.552
30.15%
1 janv. 2008
2.755
+0.372
15.61%
1 janv. 2009
2.663
-0.092
-3.34%
1 janv. 2010
2.539
-0.124
-4.67%
1 janv. 2011
2.993
+0.454
17.89%
1 janv. 2012
3.99
+0.996
33.29%
1 janv. 2013
3.808
-0.181
-4.55%
1 janv. 2014
3.108
-0.701
-18.4%
1 janv. 2015
2.875
-0.233
-7.5%
1 janv. 2016
2.579
-0.295
-10.27%
Classement des pays selon les statistiques actuelles par années


Commentaires: