29
/fr/
fr
AIzaSyAYiBZKx7MnpbEhh9jyipgxe19OcubqV5w
April 1, 2024
194358
Mauritius
MUS
true
2
1
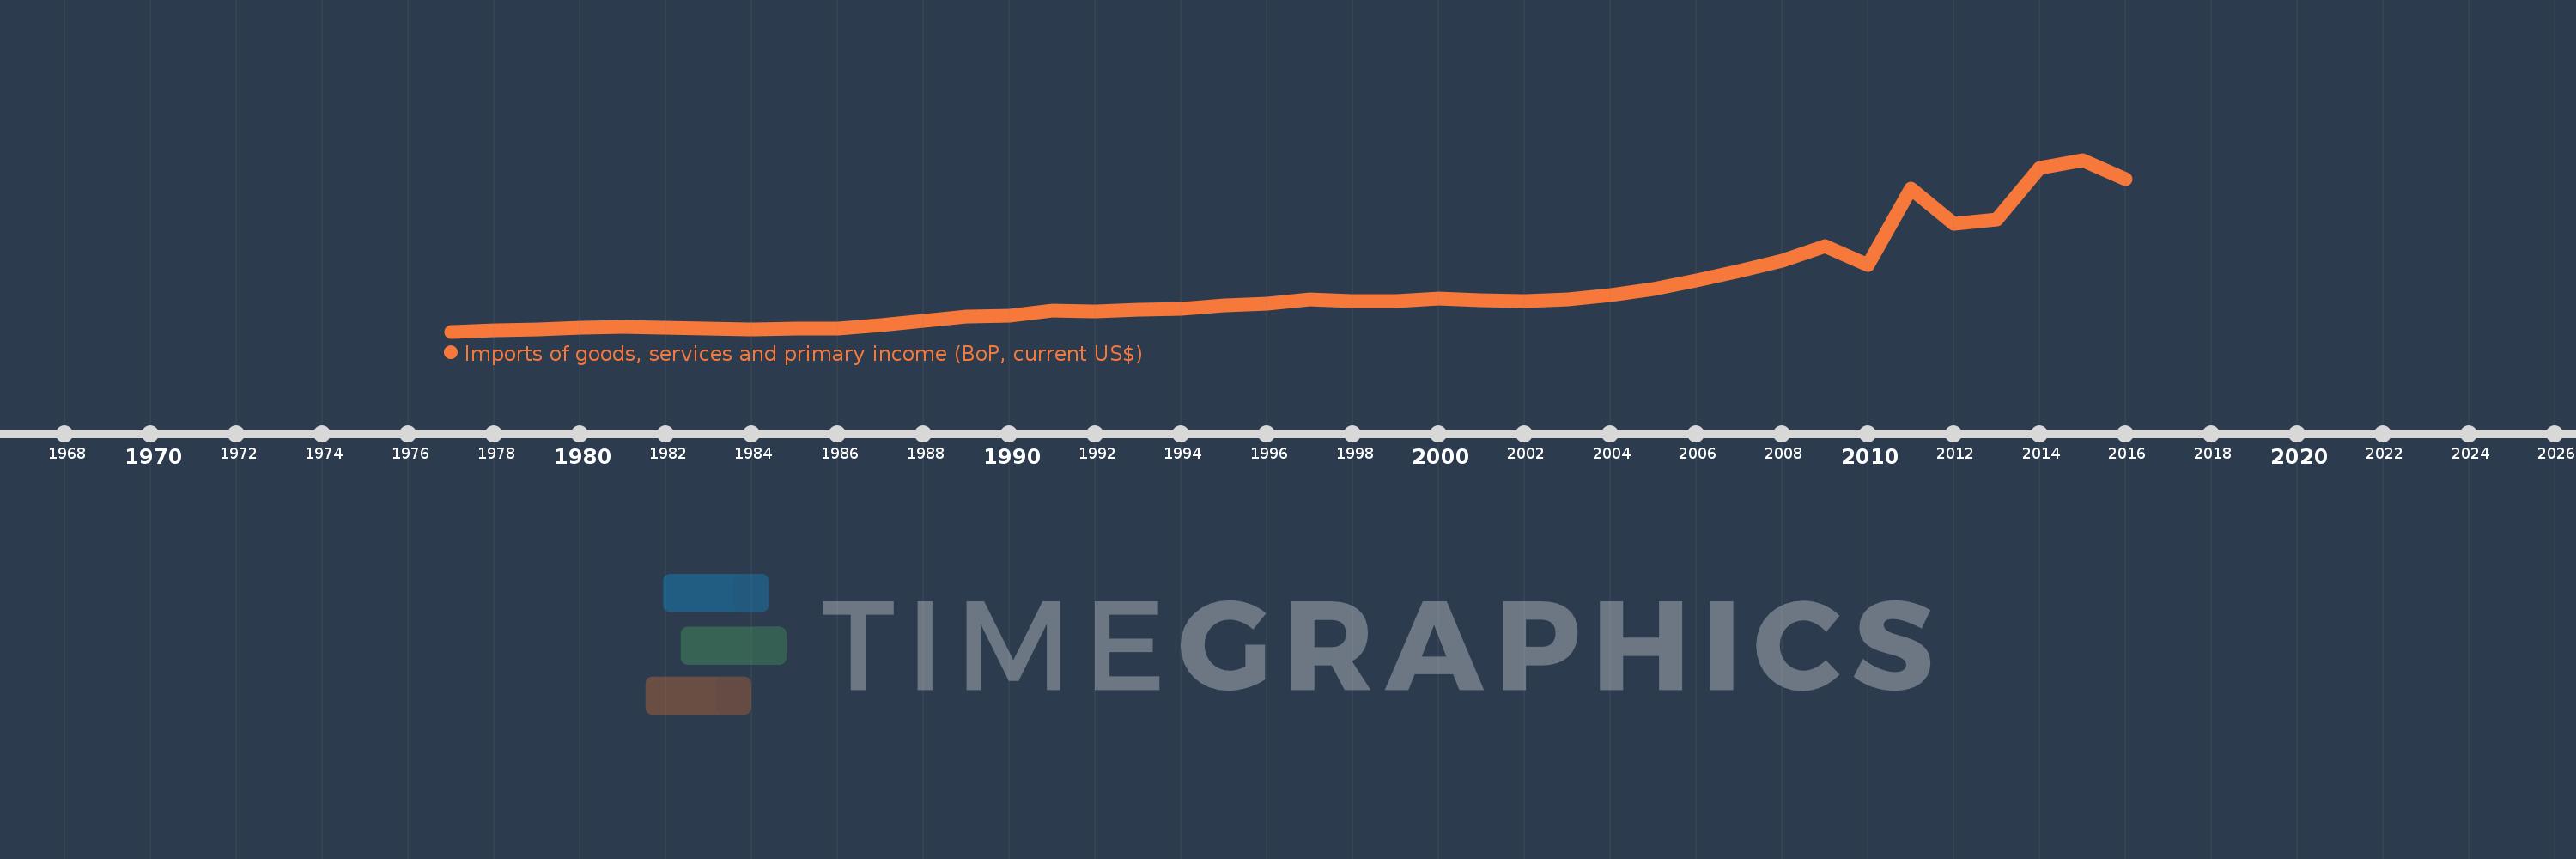
Imports of goods, services and primary income (BoP, current US$)
2016,2015,2014,2013,2012,2011,2010,2009,2008,2007,2006,2005,2004,2003,2002,2001,2000,1999,1998,1997,1996,1995,1994,1993,1992,1991,1990,1989,1988,1987,1986,1985,1984,1983,1982,1981,1980,1979,1978,1977
Cette statistique dans les autres pays:
AfghanistanAlbaniaAlgeriaAngolaAntigua and BarbudaArab WorldArgentinaArmeniaArubaAustraliaAustriaAzerbaijanBahamas, TheBahrainBangladeshBarbadosBelarusBelgiumBelizeBeninBermudaBhutanBoliviaBosnia and HerzegovinaBotswanaBrazilBrunei DarussalamBulgariaBurkina FasoBurundiCabo VerdeCambodiaCameroonCanadaCaribbean small statesCentral African RepublicCentral Europe and the BalticsChadChileChinaColombiaComorosCongo, Dem. Rep.Congo, Rep.Costa RicaCote d'IvoireCroatiaCuracaoCyprusCzech RepublicDenmarkDjiboutiDominicaDominican RepublicEarly-demographic dividendEast Asia & PacificEast Asia & Pacific (excluding high income)East Asia & Pacific (IDA & IBRD countries)EcuadorEgypt, Arab Rep.El SalvadorEquatorial GuineaEritreaEstoniaEthiopiaEuro areaEurope & Central AsiaEurope & Central Asia (excluding high income)Europe & Central Asia (IDA & IBRD countries)European UnionFaroe IslandsFijiFinlandFragile and conflict affected situationsFranceFrench PolynesiaGabonGambia, TheGeorgiaGermanyGhanaGreeceGrenadaGuatemalaGuineaGuinea-BissauGuyanaHaitiHeavily indebted poor countries (HIPC)High incomeHondurasHong Kong SAR, ChinaHungaryIBRD onlyIcelandIDA & IBRD totalIDA blendIDA onlyIDA totalIndiaIndonesiaIran, Islamic Rep.IraqIrelandIsraelItalyJamaicaJapanJordanKazakhstanKenyaKiribatiKorea, Rep.KosovoKuwaitKyrgyz RepublicLao PDRLate-demographic dividendLatin America & Caribbean Latin America & Caribbean (excluding high income)Latin America & the Caribbean (IDA & IBRD countries)LatviaLeast developed countries: UN classificationLebanonLesothoLiberiaLibyaLithuaniaLow & middle incomeLow incomeLower middle incomeLuxembourgMacao SAR, ChinaMacedonia, FYRMadagascarMalawiMalaysiaMaldivesMaliMaltaMarshall IslandsMauritaniaMauritiusMexicoMicronesia, Fed. Sts.Middle East & North Africa (excluding high income)Middle East & North Africa (IDA & IBRD countries)Middle incomeMoldovaMongoliaMontenegroMoroccoMozambiqueMyanmarNamibiaNepalNetherlandsNew CaledoniaNicaraguaNigerNigeriaNorth AmericaNorwayOECD membersOmanOther small statesPacific island small statesPakistanPalauPanamaPapua New GuineaParaguayPeruPhilippinesPolandPortugalPost-demographic dividendPre-demographic dividendQatarRomaniaRussian FederationRwandaSamoaSao Tome and PrincipeSaudi ArabiaSenegalSerbiaSeychellesSierra LeoneSingaporeSint Maarten (Dutch part)Slovak RepublicSloveniaSmall statesSolomon IslandsSouth AfricaSouth AsiaSouth Asia (IDA & IBRD)South SudanSpainSri LankaSt. Kitts and NevisSt. LuciaSt. Vincent and the GrenadinesSub-Saharan Africa Sub-Saharan Africa (excluding high income)Sub-Saharan Africa (IDA & IBRD countries)SudanSurinameSwazilandSwedenSwitzerlandSyrian Arab RepublicTajikistanTanzaniaThailandTimor-LesteTogoTongaTrinidad and TobagoTunisiaTurkeyTuvaluUgandaUkraineUnited KingdomUnited StatesUpper middle incomeUruguayVanuatuVenezuela, RBVietnamWest Bank and GazaWorldYemen, Rep.ZambiaZimbabwe La ligne de temps
Cette échelle de temps montre un graphique de 1977 année à 2016 année Mauritius. Les données jusqu'à 1976 année ne sont pas présentés. Quantité d'observations actuelles selon dates: 40.
Source (désignation):
Les indicateurs du développement mondiale
Source (organisation):
International Monetary Fund, Balance of Payments Statistics Yearbook and data files.
Catégories:
Economy & Growth, External Debt, Trade
Dernière mise à jour
23 avr. 2017
Les indicateurs de changement de valeurs selon les années
Minimum:
382.847 mln.
1 janv. 1977
Maximum:
13.579 mds
1 janv. 2015
Pour la date d''observation
Valeur
Changement absolu
Le changement par rapport à la valeur précédente
1 janv. 1977
382.847 mln.
+382.847 mln.
0.0%
1 janv. 1978
496.269 mln.
+113.422 mln.
29.63%
1 janv. 1979
575.668 mln.
+79.399 mln.
16.0%
1 janv. 1980
677.858 mln.
+102.19 mln.
17.75%
1 janv. 1981
718.088 mln.
+40.231 mln.
5.93%
1 janv. 1982
678.45 mln.
-39.638 mln.
-5.52%
1 janv. 1983
587.351 mln.
-91.1 mln.
-13.43%
1 janv. 1984
556.372 mln.
-30.979 mln.
-5.27%
1 janv. 1985
589.551 mln.
+33.179 mln.
5.96%
1 janv. 1986
643.031 mln.
+53.48 mln.
9.07%
1 janv. 1987
846.406 mln.
+203.374 mln.
31.63%
1 janv. 1988
1.228 mds
+381.404 mln.
45.06%
1 janv. 1989
1.556 mds
+327.811 mln.
26.7%
1 janv. 1990
1.629 mds
+73.257 mln.
4.71%
1 janv. 1991
1.994 mds
+365.61 mln.
22.45%
1 janv. 1992
1.964 mds
-30.688 mln.
-1.54%
1 janv. 1993
2.097 mds
+132.94 mln.
6.77%
1 janv. 1994
2.164 mds
+67.468 mln.
3.22%
1 janv. 1995
2.377 mds
+212.469 mln.
9.82%
1 janv. 1996
2.525 mds
+148.182 mln.
6.23%
1 janv. 1997
2.884 mds
+359.463 mln.
14.24%
1 janv. 1998
2.757 mds
-127.268 mln.
-4.41%
1 janv. 1999
2.726 mds
-31.303 mln.
-1.14%
1 janv. 2000
2.896 mds
+169.848 mln.
6.23%
1 janv. 2001
2.772 mds
-123.842 mln.
-4.28%
1 janv. 2002
2.717 mds
-54.777 mln.
-1.98%
1 janv. 2003
2.872 mds
+155.001 mln.
5.7%
1 janv. 2004
3.184 mds
+312.46 mln.
10.88%
1 janv. 2005
3.662 mds
+477.154 mln.
14.98%
1 janv. 2006
4.284 mds
+622.688 mln.
17.01%
1 janv. 2007
5.05 mds
+765.218 mln.
17.86%
1 janv. 2008
5.818 mds
+768.797 mln.
15.23%
1 janv. 2009
6.948 mds
+1.129 mds
19.41%
1 janv. 2010
5.514 mds
-1.434 mds
-20.64%
1 janv. 2011
11.378 mds
+5.864 mds
106.35%
1 janv. 2012
8.664 mds
-2.714 mds
-23.85%
1 janv. 2013
9.017 mds
+353.616 mln.
4.08%
1 janv. 2014
12.926 mds
+3.909 mds
43.35%
1 janv. 2015
13.579 mds
+652.415 mln.
5.05%
1 janv. 2016
12.113 mds
-1.465 mds
-10.79%
Classement des pays selon les statistiques actuelles par années


Commentaires: