29
/fr/
fr
AIzaSyAYiBZKx7MnpbEhh9jyipgxe19OcubqV5w
April 1, 2024
193114
Mauritania
MRT
true
2
1
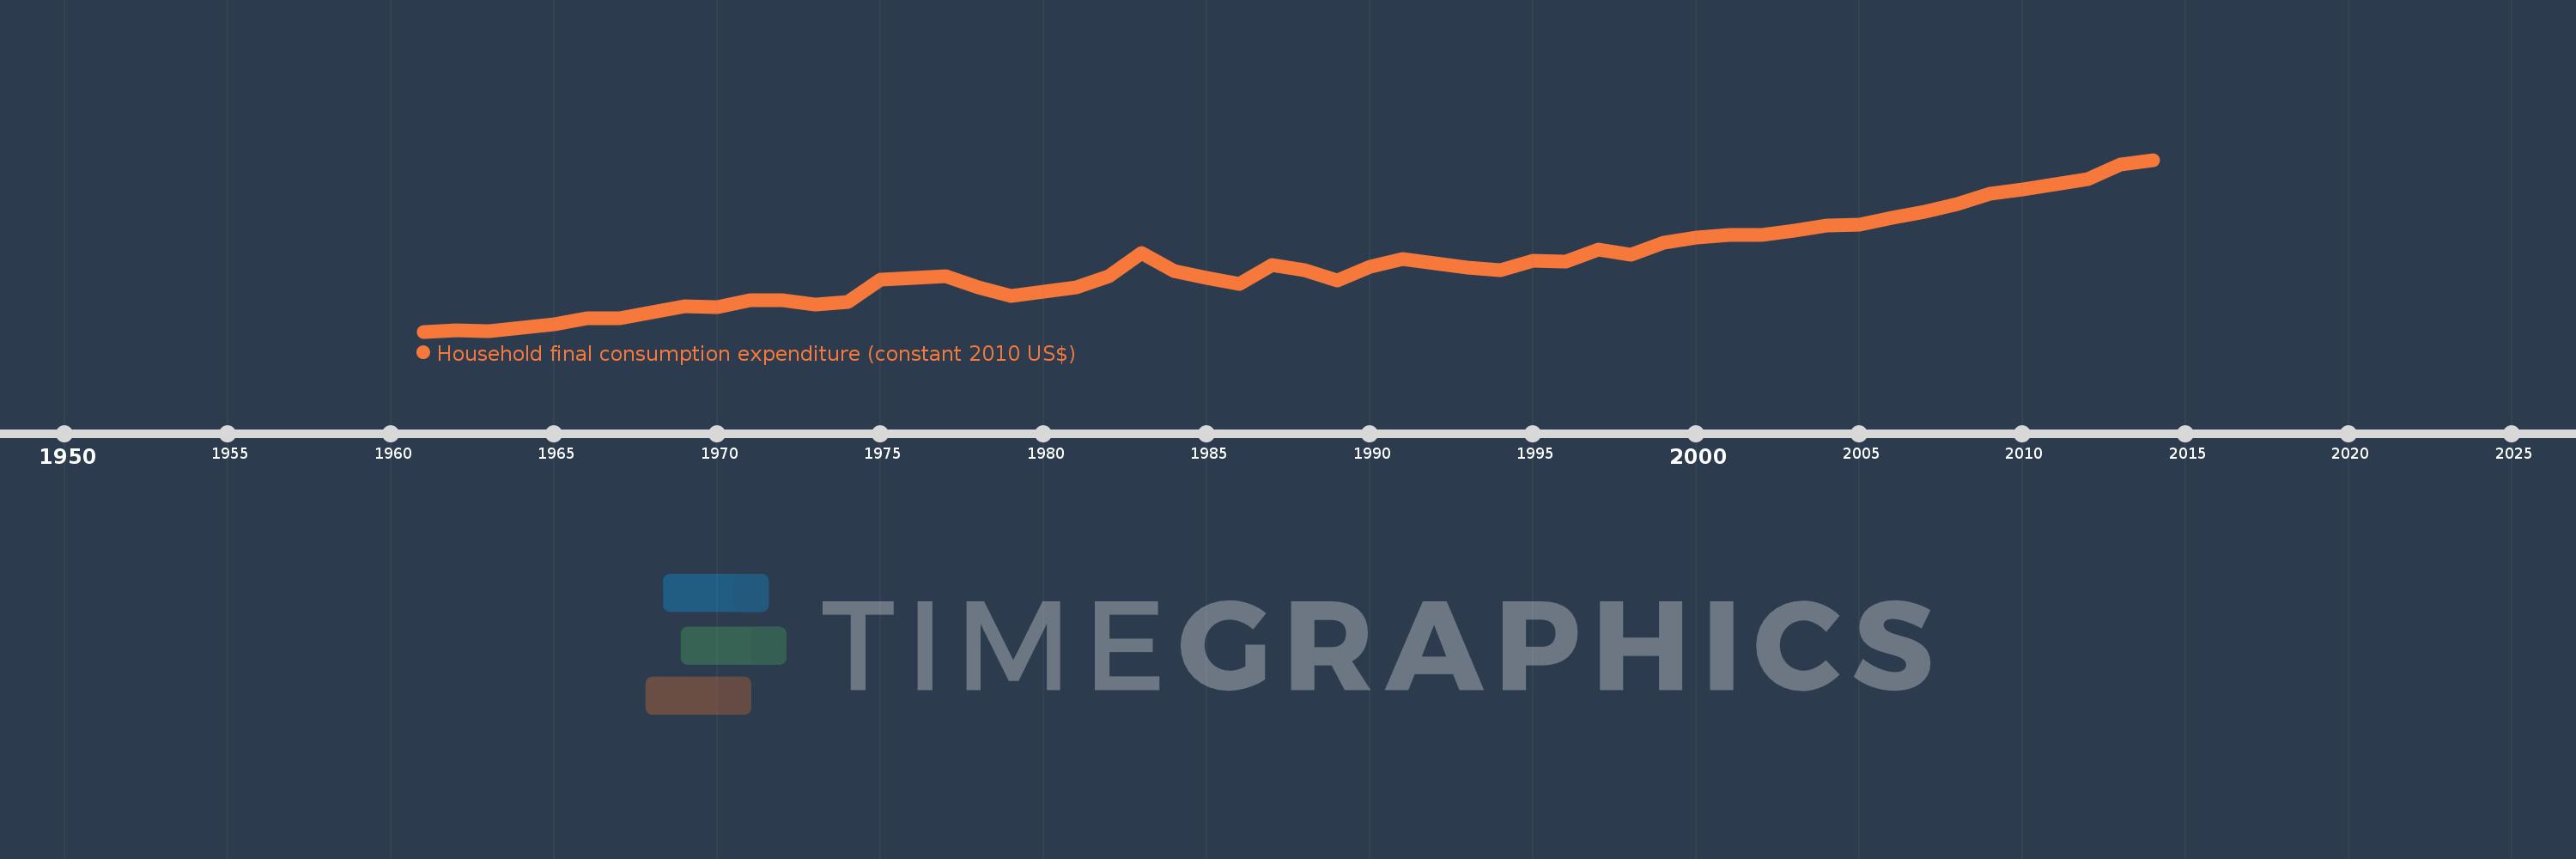
Household final consumption expenditure (constant 2010 US$)
2014,2013,2012,2011,2010,2009,2008,2007,2006,2005,2004,2003,2002,2001,2000,1999,1998,1997,1996,1995,1994,1993,1992,1991,1990,1989,1988,1987,1986,1985,1984,1983,1982,1981,1980,1979,1978,1977,1976,1975,1974,1973,1972,1971,1970,1969,1968,1967,1966,1965,1964,1963,1962,1961
Cette statistique dans les autres pays:
AfghanistanAlbaniaAlgeriaAngolaAntigua and BarbudaArab WorldArgentinaArmeniaArubaAustraliaAustriaAzerbaijanBahamas, TheBahrainBangladeshBarbadosBelarusBelgiumBelizeBeninBermudaBhutanBoliviaBosnia and HerzegovinaBotswanaBrazilBrunei DarussalamBulgariaBurkina FasoBurundiCabo VerdeCambodiaCameroonCanadaCaribbean small statesCentral African RepublicCentral Europe and the BalticsChadChileChinaColombiaComorosCongo, Dem. Rep.Congo, Rep.Costa RicaCote d'IvoireCroatiaCubaCyprusCzech RepublicDenmarkDominicaDominican RepublicEarly-demographic dividendEast Asia & PacificEast Asia & Pacific (excluding high income)East Asia & Pacific (IDA & IBRD countries)EcuadorEgypt, Arab Rep.El SalvadorEquatorial GuineaEritreaEstoniaEuro areaEurope & Central AsiaEurope & Central Asia (excluding high income)Europe & Central Asia (IDA & IBRD countries)European UnionFaroe IslandsFinlandFranceGabonGambia, TheGeorgiaGermanyGhanaGreeceGrenadaGuatemalaGuineaGuinea-BissauGuyanaHaitiHeavily indebted poor countries (HIPC)High incomeHondurasHong Kong SAR, ChinaHungaryIBRD onlyIcelandIDA & IBRD totalIDA blendIDA onlyIDA totalIndiaIndonesiaIran, Islamic Rep.IrelandIsraelItalyJamaicaJapanJordanKazakhstanKenyaKorea, Rep.KosovoKuwaitKyrgyz RepublicLao PDRLate-demographic dividendLatin America & Caribbean Latin America & Caribbean (excluding high income)Latin America & the Caribbean (IDA & IBRD countries)LatviaLeast developed countries: UN classificationLebanonLiberiaLithuaniaLow & middle incomeLow incomeLower middle incomeLuxembourgMacao SAR, ChinaMacedonia, FYRMadagascarMalawiMalaysiaMaliMaltaMauritaniaMauritiusMexicoMiddle East & North AfricaMiddle East & North Africa (excluding high income)Middle East & North Africa (IDA & IBRD countries)Middle incomeMoldovaMongoliaMontenegroMoroccoMozambiqueNamibiaNepalNetherlandsNew ZealandNicaraguaNigerNigeriaNorth AmericaNorwayOECD membersOmanOther small statesPakistanPanamaParaguayPeruPhilippinesPolandPortugalPost-demographic dividendPre-demographic dividendPuerto RicoQatarRomaniaRussian FederationRwandaSaudi ArabiaSenegalSerbiaSeychellesSierra LeoneSingaporeSlovak RepublicSloveniaSmall statesSouth AfricaSouth AsiaSouth Asia (IDA & IBRD)South SudanSpainSri LankaSt. Kitts and NevisSt. LuciaSt. Vincent and the GrenadinesSub-Saharan Africa Sub-Saharan Africa (excluding high income)Sub-Saharan Africa (IDA & IBRD countries)SudanSurinameSwazilandSwedenSwitzerlandTajikistanTanzaniaThailandTimor-LesteTogoTongaTrinidad and TobagoTunisiaTurkeyTurkmenistanUgandaUkraineUnited Arab EmiratesUnited KingdomUnited StatesUpper middle incomeUruguayUzbekistanVanuatuVenezuela, RBVietnamWest Bank and GazaWorldYemen, Rep.ZambiaZimbabwe La ligne de temps
Cette échelle de temps montre un graphique de 1961 année à 2014 année Mauritania. Les données jusqu'à 1960 année ne sont pas présentés. Quantité d'observations actuelles selon dates: 54.
Source (désignation):
Les indicateurs du développement mondiale
Source (organisation):
World Bank national accounts data, and OECD National Accounts data files.
Catégories:
Economy & Growth
Dernière mise à jour
23 avr. 2017
Les indicateurs de changement de valeurs selon les années
Minimum:
256.389 mln.
1 janv. 1961
Maximum:
2.552 mds
1 janv. 2014
Pour la date d''observation
Valeur
Changement absolu
Le changement par rapport à la valeur précédente
1 janv. 1961
256.389 mln.
+256.389 mln.
0.0%
1 janv. 1962
273.073 mln.
+16.684 mln.
6.51%
1 janv. 1963
262.177 mln.
-10.896 mln.
-3.99%
1 janv. 1964
303.377 mln.
+41.199 mln.
15.71%
1 janv. 1965
355.131 mln.
+51.754 mln.
17.06%
1 janv. 1966
437.87 mln.
+82.739 mln.
23.3%
1 janv. 1967
433.572 mln.
-4.299 mln.
-0.98%
1 janv. 1968
510.132 mln.
+76.56 mln.
17.66%
1 janv. 1969
592.377 mln.
+82.245 mln.
16.12%
1 janv. 1970
580.514 mln.
-11.863 mln.
-2.0%
1 janv. 1971
679.816 mln.
+99.303 mln.
17.11%
1 janv. 1972
681.008 mln.
+1.191 mln.
0.18%
1 janv. 1973
615.267 mln.
-65.74 mln.
-9.65%
1 janv. 1974
653.763 mln.
+38.496 mln.
6.26%
1 janv. 1975
949.131 mln.
+295.368 mln.
45.18%
1 janv. 1976
972.502 mln.
+23.371 mln.
2.46%
1 janv. 1977
995.087 mln.
+22.585 mln.
2.32%
1 janv. 1978
844.103 mln.
-150.984 mln.
-15.17%
1 janv. 1979
735.098 mln.
-109.005 mln.
-12.91%
1 janv. 1980
784.995 mln.
+49.897 mln.
6.79%
1 janv. 1981
843.692 mln.
+58.697 mln.
7.48%
1 janv. 1982
996.105 mln.
+152.413 mln.
18.06%
1 janv. 1983
1.303 mds
+306.697 mln.
30.79%
1 janv. 1984
1.071 mds
-231.809 mln.
-17.79%
1 janv. 1985
970.685 mln.
-100.309 mln.
-9.37%
1 janv. 1986
897.103 mln.
-73.582 mln.
-7.58%
1 janv. 1987
1.149 mds
+251.523 mln.
28.04%
1 janv. 1988
1.079 mds
-69.886 mln.
-6.08%
1 janv. 1989
943.348 mln.
-135.392 mln.
-12.55%
1 janv. 1990
1.126 mds
+182.986 mln.
19.4%
1 janv. 1991
1.224 mds
+97.721 mln.
8.68%
1 janv. 1992
1.165 mds
-58.837 mln.
-4.81%
1 janv. 1993
1.109 mds
-56.009 mln.
-4.81%
1 janv. 1994
1.082 mds
-26.919 mln.
-2.43%
1 janv. 1995
1.209 mds
+126.698 mln.
11.71%
1 janv. 1996
1.195 mds
-14.383 mln.
-1.19%
1 janv. 1997
1.348 mds
+153.22 mln.
12.83%
1 janv. 1998
1.281 mds
-66.777 mln.
-4.95%
1 janv. 1999
1.443 mds
+162.406 mln.
12.68%
1 janv. 2000
1.511 mds
+67.592 mln.
4.68%
1 janv. 2001
1.543 mds
+31.831 mln.
2.11%
1 janv. 2002
1.545 mds
+2.003 mln.
0.13%
1 janv. 2003
1.605 mds
+60.148 mln.
3.89%
1 janv. 2004
1.676 mds
+71.195 mln.
4.44%
1 janv. 2005
1.688 mds
+12.102 mln.
0.72%
1 janv. 2006
1.783 mds
+94.833 mln.
5.62%
1 janv. 2007
1.857 mds
+73.441 mln.
4.12%
1 janv. 2008
1.959 mds
+102.519 mln.
5.52%
1 janv. 2009
2.103 mds
+144.071 mln.
7.35%
1 janv. 2010
2.158 mds
+54.683 mln.
2.6%
1 janv. 2011
2.228 mds
+69.926 mln.
3.24%
1 janv. 2012
2.294 mds
+66.381 mln.
2.98%
1 janv. 2013
2.493 mds
+198.359 mln.
8.65%
1 janv. 2014
2.552 mds
+59.792 mln.
2.4%
Classement des pays selon les statistiques actuelles par années


Commentaires: