29
/fr/
fr
AIzaSyAYiBZKx7MnpbEhh9jyipgxe19OcubqV5w
April 1, 2024
192959
Mauritania
MRT
true
2
1
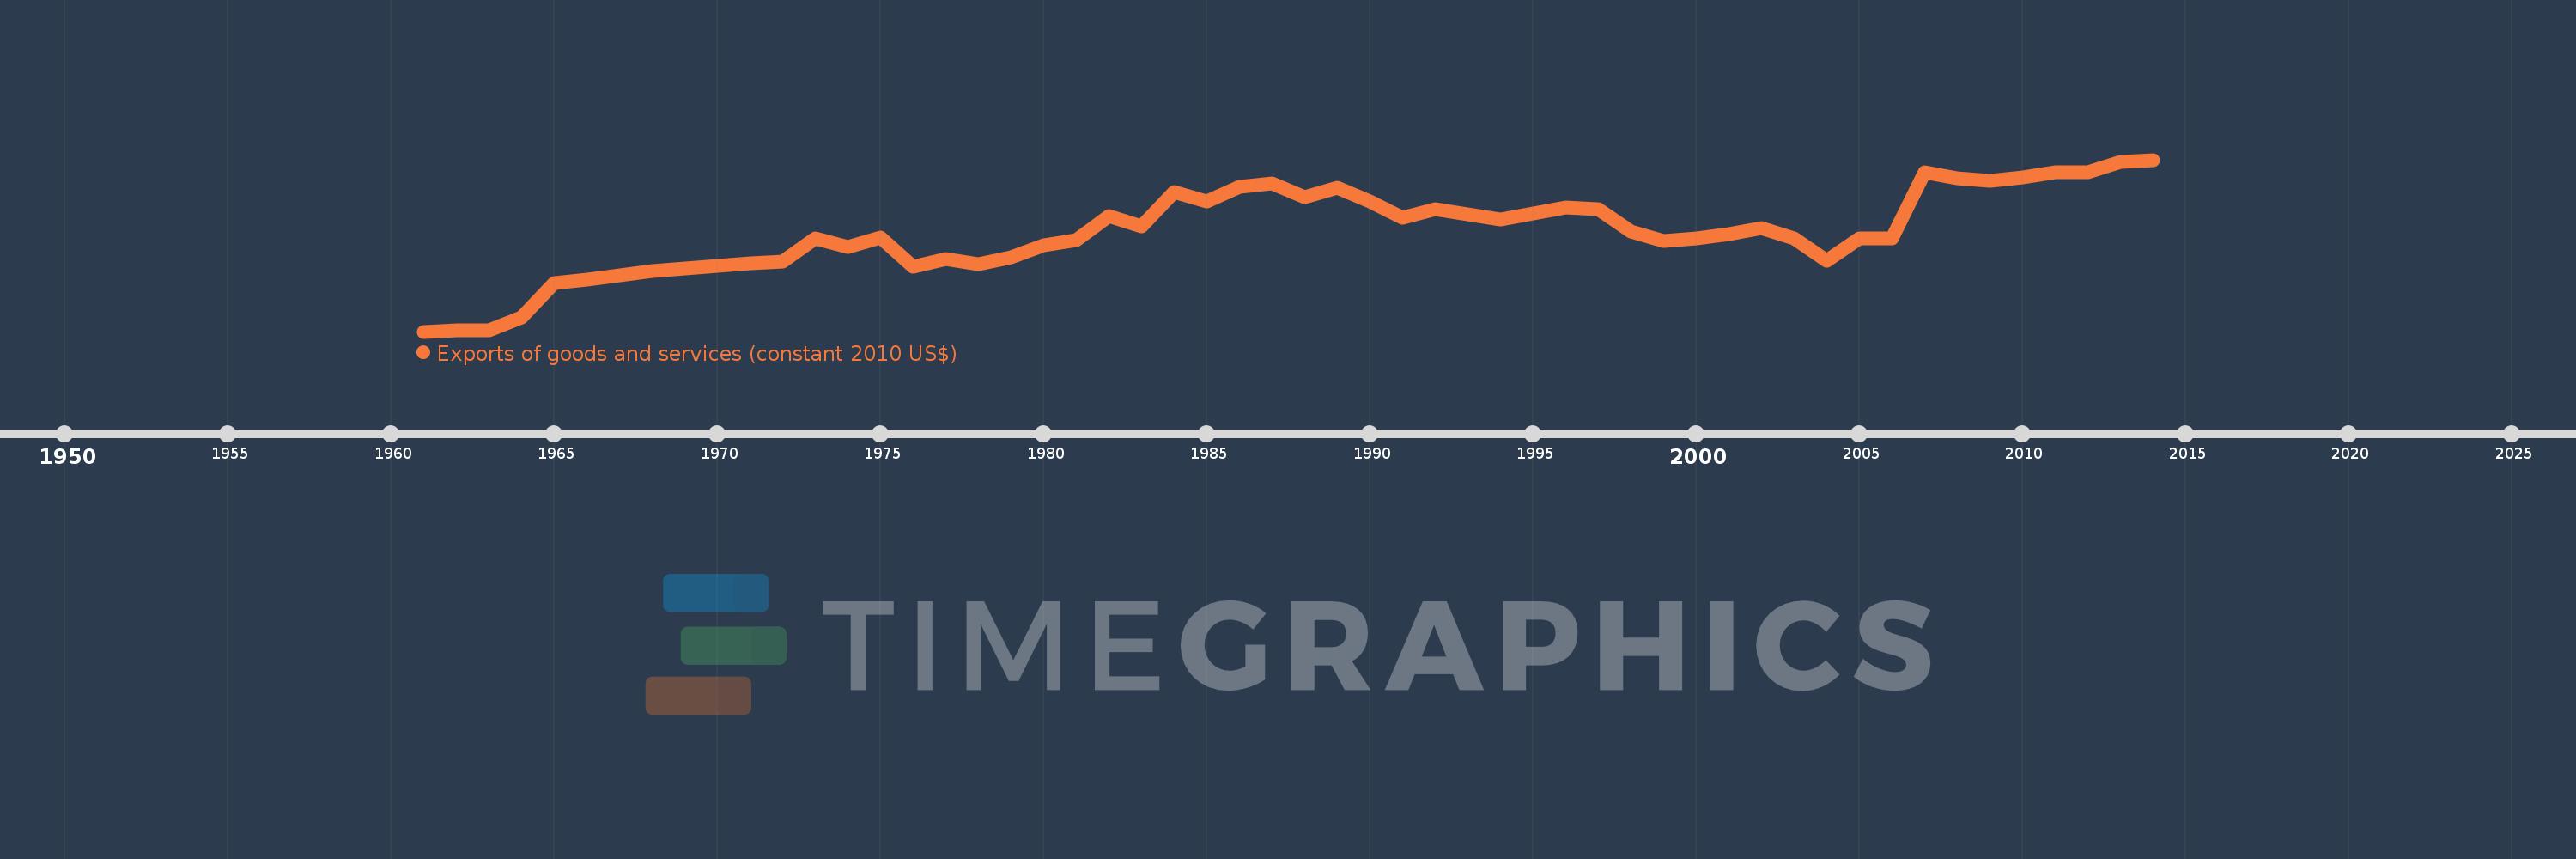
Exports of goods and services (constant 2010 US$)
2014,2013,2012,2011,2010,2009,2008,2007,2006,2005,2004,2003,2002,2001,2000,1999,1998,1997,1996,1995,1994,1993,1992,1991,1990,1989,1988,1987,1986,1985,1984,1983,1982,1981,1980,1979,1978,1977,1976,1975,1974,1973,1972,1971,1970,1969,1968,1967,1966,1965,1964,1963,1962,1961
Cette statistique dans les autres pays:
AfghanistanAlbaniaAlgeriaAngolaAntigua and BarbudaArab WorldArgentinaArmeniaArubaAustraliaAustriaAzerbaijanBahamas, TheBahrainBangladeshBarbadosBelarusBelgiumBelizeBeninBermudaBhutanBoliviaBosnia and HerzegovinaBotswanaBrazilBrunei DarussalamBulgariaBurkina FasoBurundiCabo VerdeCambodiaCameroonCanadaCaribbean small statesCentral African RepublicCentral Europe and the BalticsChadChileChinaColombiaComorosCongo, Dem. Rep.Congo, Rep.Costa RicaCote d'IvoireCroatiaCubaCyprusCzech RepublicDenmarkDominicaDominican RepublicEarly-demographic dividendEast Asia & PacificEast Asia & Pacific (excluding high income)East Asia & Pacific (IDA & IBRD countries)EcuadorEgypt, Arab Rep.El SalvadorEquatorial GuineaEritreaEstoniaEuro areaEurope & Central AsiaEurope & Central Asia (excluding high income)Europe & Central Asia (IDA & IBRD countries)European UnionFaroe IslandsFijiFinlandFragile and conflict affected situationsFranceGabonGambia, TheGeorgiaGermanyGhanaGreeceGrenadaGuatemalaGuineaGuinea-BissauGuyanaHaitiHeavily indebted poor countries (HIPC)High incomeHondurasHong Kong SAR, ChinaHungaryIBRD onlyIcelandIDA & IBRD totalIDA blendIDA onlyIDA totalIndiaIndonesiaIran, Islamic Rep.IraqIrelandIsraelItalyJamaicaJapanJordanKazakhstanKenyaKiribatiKorea, Rep.KosovoKuwaitKyrgyz RepublicLao PDRLate-demographic dividendLatin America & Caribbean Latin America & Caribbean (excluding high income)Latin America & the Caribbean (IDA & IBRD countries)LatviaLeast developed countries: UN classificationLebanonLiberiaLibyaLithuaniaLow & middle incomeLow incomeLower middle incomeLuxembourgMacao SAR, ChinaMacedonia, FYRMadagascarMalawiMalaysiaMaldivesMaliMaltaMauritaniaMauritiusMexicoMiddle East & North AfricaMiddle East & North Africa (excluding high income)Middle East & North Africa (IDA & IBRD countries)Middle incomeMoldovaMongoliaMontenegroMoroccoMozambiqueMyanmarNamibiaNepalNetherlandsNew ZealandNicaraguaNigerNigeriaNorth AmericaNorwayOECD membersOmanOther small statesPacific island small statesPakistanPalauPanamaParaguayPeruPhilippinesPolandPortugalPost-demographic dividendPre-demographic dividendPuerto RicoQatarRomaniaRussian FederationRwandaSamoaSaudi ArabiaSenegalSerbiaSeychellesSierra LeoneSingaporeSlovak RepublicSloveniaSmall statesSolomon IslandsSouth AfricaSouth AsiaSouth Asia (IDA & IBRD)South SudanSpainSri LankaSt. Kitts and NevisSt. LuciaSt. Vincent and the GrenadinesSub-Saharan Africa Sub-Saharan Africa (excluding high income)Sub-Saharan Africa (IDA & IBRD countries)SudanSurinameSwazilandSwedenSwitzerlandTajikistanTanzaniaThailandTimor-LesteTogoTongaTrinidad and TobagoTunisiaTurkeyTurkmenistanUgandaUkraineUnited Arab EmiratesUnited KingdomUnited StatesUpper middle incomeUruguayUzbekistanVanuatuVenezuela, RBVietnamWest Bank and GazaWorldYemen, Rep.ZambiaZimbabwe La ligne de temps
Cette échelle de temps montre un graphique de 1961 année à 2014 année Mauritania. Les données jusqu'à 1960 année ne sont pas présentés. Quantité d'observations actuelles selon dates: 54.
Source (désignation):
Les indicateurs du développement mondiale
Source (organisation):
World Bank national accounts data, and OECD National Accounts data files.
Catégories:
Economy & Growth, Trade
Dernière mise à jour
23 avr. 2017
Les indicateurs de changement de valeurs selon les années
Minimum:
160.012 mln.
1 janv. 1961
Maximum:
2.358 mds
1 janv. 2014
Pour la date d''observation
Valeur
Changement absolu
Le changement par rapport à la valeur précédente
1 janv. 1961
160.012 mln.
+160.012 mln.
0.0%
1 janv. 1962
173.551 mln.
+13.539 mln.
8.46%
1 janv. 1963
179.706 mln.
+6.154 mln.
3.55%
1 janv. 1964
338.487 mln.
+158.781 mln.
88.36%
1 janv. 1965
781.597 mln.
+443.11 mln.
130.91%
1 janv. 1966
829.6 mln.
+48.004 mln.
6.14%
1 janv. 1967
885.12 mln.
+55.519 mln.
6.69%
1 janv. 1968
940.251 mln.
+55.131 mln.
6.23%
1 janv. 1969
972.472 mln.
+32.221 mln.
3.43%
1 janv. 1970
995.248 mln.
+22.776 mln.
2.34%
1 janv. 1971
1.039 mds
+43.928 mln.
4.41%
1 janv. 1972
1.056 mds
+16.356 mln.
1.57%
1 janv. 1973
1.347 mds
+291.96 mln.
27.66%
1 janv. 1974
1.245 mds
-102.896 mln.
-7.64%
1 janv. 1975
1.363 mds
+118.196 mln.
9.5%
1 janv. 1976
994.851 mln.
-367.94 mln.
-27.0%
1 janv. 1977
1.084 mds
+88.748 mln.
8.92%
1 janv. 1978
1.027 mds
-56.238 mln.
-5.19%
1 janv. 1979
1.11 mds
+82.833 mln.
8.06%
1 janv. 1980
1.264 mds
+153.748 mln.
13.85%
1 janv. 1981
1.332 mds
+67.677 mln.
5.35%
1 janv. 1982
1.639 mds
+307.312 mln.
23.08%
1 janv. 1983
1.504 mds
-135.164 mln.
-8.25%
1 janv. 1984
1.951 mds
+447.241 mln.
29.74%
1 janv. 1985
1.823 mds
-128.205 mln.
-6.57%
1 janv. 1986
2.011 mds
+187.863 mln.
10.31%
1 janv. 1987
2.057 mds
+45.961 mln.
2.29%
1 janv. 1988
1.88 mds
-176.514 mln.
-8.58%
1 janv. 1989
2.004 mds
+123.628 mln.
6.58%
1 janv. 1990
1.821 mds
-182.489 mln.
-9.11%
1 janv. 1991
1.621 mds
-199.809 mln.
-10.97%
1 janv. 1992
1.724 mds
+102.152 mln.
6.3%
1 janv. 1993
1.662 mds
-61.28 mln.
-3.56%
1 janv. 1994
1.598 mds
-64.779 mln.
-3.9%
1 janv. 1995
1.676 mds
+78.693 mln.
4.93%
1 janv. 1996
1.743 mds
+66.487 mln.
3.97%
1 janv. 1997
1.725 mds
-18.15 mln.
-1.04%
1 janv. 1998
1.44 mds
-284.248 mln.
-16.48%
1 janv. 1999
1.324 mds
-116.229 mln.
-8.07%
1 janv. 2000
1.352 mds
+27.958 mln.
2.11%
1 janv. 2001
1.407 mds
+54.673 mln.
4.04%
1 janv. 2002
1.488 mds
+81.668 mln.
5.81%
1 janv. 2003
1.348 mds
-140.19 mln.
-9.42%
1 janv. 2004
1.07 mds
-278.617 mln.
-20.67%
1 janv. 2005
1.347 mds
+277.731 mln.
25.97%
1 janv. 2006
1.347 mds
+54.056 milles
0.0%
1 janv. 2007
2.203 mds
+856.134 mln.
63.54%
1 janv. 2008
2.123 mds
-80.652 mln.
-3.66%
1 janv. 2009
2.086 mds
-36.363 mln.
-1.71%
1 janv. 2010
2.132 mds
+45.598 mln.
2.19%
1 janv. 2011
2.201 mds
+69.117 mln.
3.24%
1 janv. 2012
2.199 mds
-2.24 mln.
-0.1%
1 janv. 2013
2.33 mds
+131.069 mln.
5.96%
1 janv. 2014
2.358 mds
+27.964 mln.
1.2%
Classement des pays selon les statistiques actuelles par années


Commentaires: