29
/fr/
fr
AIzaSyAYiBZKx7MnpbEhh9jyipgxe19OcubqV5w
April 1, 2024
192671
Mauritania
MRT
true
2
1
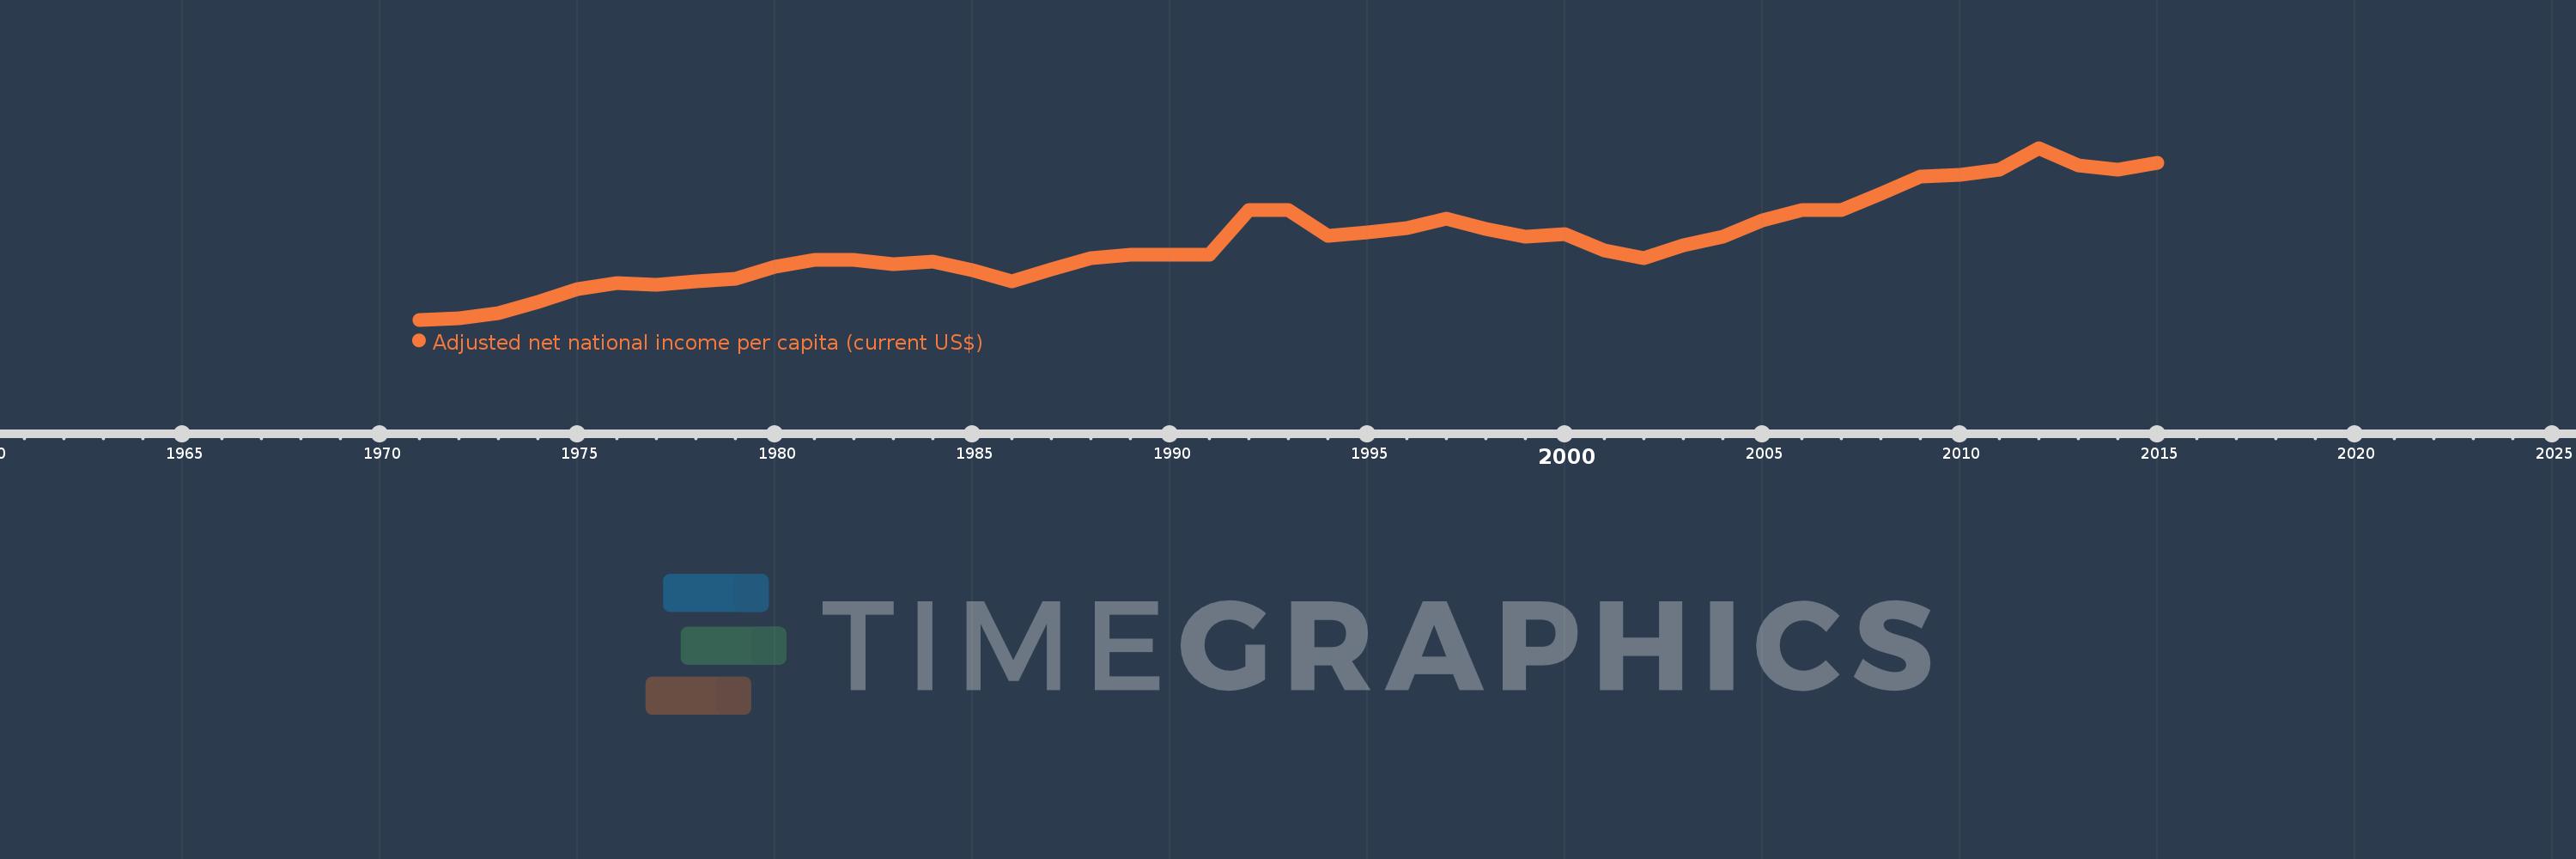
Adjusted net national income per capita (current US$)
2015,2014,2013,2012,2011,2010,2009,2008,2007,2006,2005,2004,2003,2002,2001,2000,1999,1998,1997,1996,1995,1994,1993,1992,1991,1990,1989,1988,1987,1986,1985,1984,1983,1982,1981,1980,1979,1978,1977,1976,1975,1974,1973,1972,1971
Cette statistique dans les autres pays:
AfghanistanAlbaniaAlgeriaAngolaArab WorldArgentinaArmeniaAustraliaAustriaAzerbaijanBahamas, TheBahrainBangladeshBarbadosBelarusBelgiumBelizeBeninBhutanBoliviaBotswanaBrazilBrunei DarussalamBulgariaBurkina FasoBurundiCabo VerdeCambodiaCameroonCanadaCaribbean small statesCentral African RepublicCentral Europe and the BalticsChadChileChinaColombiaComorosCongo, Dem. Rep.Congo, Rep.Costa RicaCote d'IvoireCroatiaCubaCyprusCzech RepublicDenmarkDjiboutiDominicaDominican RepublicEarly-demographic dividendEast Asia & PacificEast Asia & Pacific (excluding high income)East Asia & Pacific (IDA & IBRD countries)EcuadorEgypt, Arab Rep.El SalvadorEquatorial GuineaEritreaEstoniaEthiopiaEuro areaEurope & Central AsiaEurope & Central Asia (excluding high income)Europe & Central Asia (IDA & IBRD countries)European UnionFijiFinlandFragile and conflict affected situationsFranceGabonGambia, TheGeorgiaGermanyGhanaGreeceGuatemalaGuineaGuinea-BissauGuyanaHaitiHeavily indebted poor countries (HIPC)High incomeHondurasHong Kong SAR, ChinaHungaryIBRD onlyIcelandIDA & IBRD totalIDA blendIDA onlyIDA totalIndiaIndonesiaIran, Islamic Rep.IraqIrelandIsraelItalyJamaicaJapanJordanKazakhstanKenyaKiribatiKorea, Rep.KuwaitKyrgyz RepublicLao PDRLate-demographic dividendLatin America & Caribbean Latin America & Caribbean (excluding high income)Latin America & the Caribbean (IDA & IBRD countries)LatviaLeast developed countries: UN classificationLebanonLesothoLiberiaLibyaLithuaniaLow & middle incomeLow incomeLower middle incomeLuxembourgMacedonia, FYRMadagascarMalawiMalaysiaMaldivesMaliMauritaniaMauritiusMexicoMiddle East & North AfricaMiddle East & North Africa (excluding high income)Middle East & North Africa (IDA & IBRD countries)Middle incomeMoldovaMongoliaMoroccoMozambiqueMyanmarNamibiaNepalNetherlandsNew ZealandNicaraguaNigerNigeriaNorth AmericaNorwayOECD membersOmanOther small statesPacific island small statesPakistanPanamaPapua New GuineaParaguayPeruPhilippinesPolandPortugalPost-demographic dividendPre-demographic dividendQatarRomaniaRussian FederationRwandaSamoaSao Tome and PrincipeSaudi ArabiaSenegalSeychellesSierra LeoneSingaporeSlovak RepublicSloveniaSmall statesSolomon IslandsSouth AfricaSouth AsiaSouth Asia (IDA & IBRD)SpainSri LankaSt. LuciaSt. Vincent and the GrenadinesSub-Saharan Africa Sub-Saharan Africa (excluding high income)Sub-Saharan Africa (IDA & IBRD countries)SudanSurinameSwazilandSwedenSwitzerlandSyrian Arab RepublicTajikistanTanzaniaThailandTogoTongaTrinidad and TobagoTunisiaTurkeyTurkmenistanUgandaUkraineUnited Arab EmiratesUnited KingdomUnited StatesUpper middle incomeUruguayUzbekistanVanuatuVenezuela, RBVietnamWorldYemen, Rep.ZambiaZimbabwe La ligne de temps
Cette échelle de temps montre un graphique de 1971 année à 2015 année Mauritania. Les données jusqu'à 1970 année ne sont pas présentés. Quantité d'observations actuelles selon dates: 45.
Source (désignation):
Les indicateurs du développement mondiale
Source (organisation):
World Bank staff estimates based on sources and methods in World Bank's "The Changing Wealth of Nations: Measuring Sustainable Development in the New Millennium" (2011).
Catégories:
Economy & Growth
Dernière mise à jour
23 avr. 2017
Les indicateurs de changement de valeurs selon les années
Minimum:
152.778
1 janv. 1971
Maximum:
824.224
1 janv. 2012
Pour la date d''observation
Valeur
Changement absolu
Le changement par rapport à la valeur précédente
1 janv. 1971
152.778
+152.778
0.0%
1 janv. 1972
159.064
+6.286
4.11%
1 janv. 1973
178.669
+19.605
12.33%
1 janv. 1974
221.554
+42.886
24.0%
1 janv. 1975
271.303
+49.749
22.45%
1 janv. 1976
296.923
+25.62
9.44%
1 janv. 1977
287.888
-9.034
-3.04%
1 janv. 1978
302.73
+14.841
5.16%
1 janv. 1979
312.994
+10.264
3.39%
1 janv. 1980
359.576
+46.582
14.88%
1 janv. 1981
386.91
+27.335
7.6%
1 janv. 1982
386.704
-0.207
-0.05%
1 janv. 1983
369.923
-16.78
-4.34%
1 janv. 1984
379.762
+9.839
2.66%
1 janv. 1985
346.008
-33.754
-8.89%
1 janv. 1986
304.49
-41.518
-12.0%
1 janv. 1987
349.396
+44.906
14.75%
1 janv. 1988
392.129
+42.733
12.23%
1 janv. 1989
408.459
+16.33
4.16%
1 janv. 1990
407.825
-0.634
-0.16%
1 janv. 1991
407.714
-0.112
-0.03%
1 janv. 1992
583.097
+175.383
43.02%
1 janv. 1993
580.827
-2.271
-0.39%
1 janv. 1994
481.249
-99.577
-17.14%
1 janv. 1995
493.522
+12.273
2.55%
1 janv. 1996
510.897
+17.375
3.52%
1 janv. 1997
546.669
+35.772
7.0%
1 janv. 1998
509.104
-37.564
-6.87%
1 janv. 1999
476.809
-32.295
-6.34%
1 janv. 2000
487.542
+10.733
2.25%
1 janv. 2001
423.357
-64.185
-13.17%
1 janv. 2002
393.335
-30.022
-7.09%
1 janv. 2003
445.155
+51.82
13.17%
1 janv. 2004
476.194
+31.038
6.97%
1 janv. 2005
542.198
+66.004
13.86%
1 janv. 2006
583.143
+40.945
7.55%
1 janv. 2007
579.923
-3.22
-0.55%
1 janv. 2008
645.231
+65.308
11.26%
1 janv. 2009
713.948
+68.716
10.65%
1 janv. 2010
718.261
+4.314
0.6%
1 janv. 2011
739.381
+21.12
2.94%
1 janv. 2012
824.224
+84.843
11.47%
1 janv. 2013
756.15
-68.074
-8.26%
1 janv. 2014
740.479
-15.671
-2.07%
1 janv. 2015
765.665
+25.186
3.4%
Classement des pays selon les statistiques actuelles par années


Commentaires: