29
/fr/
fr
AIzaSyAYiBZKx7MnpbEhh9jyipgxe19OcubqV5w
April 1, 2024
191450
Malta
MLT
true
2
1
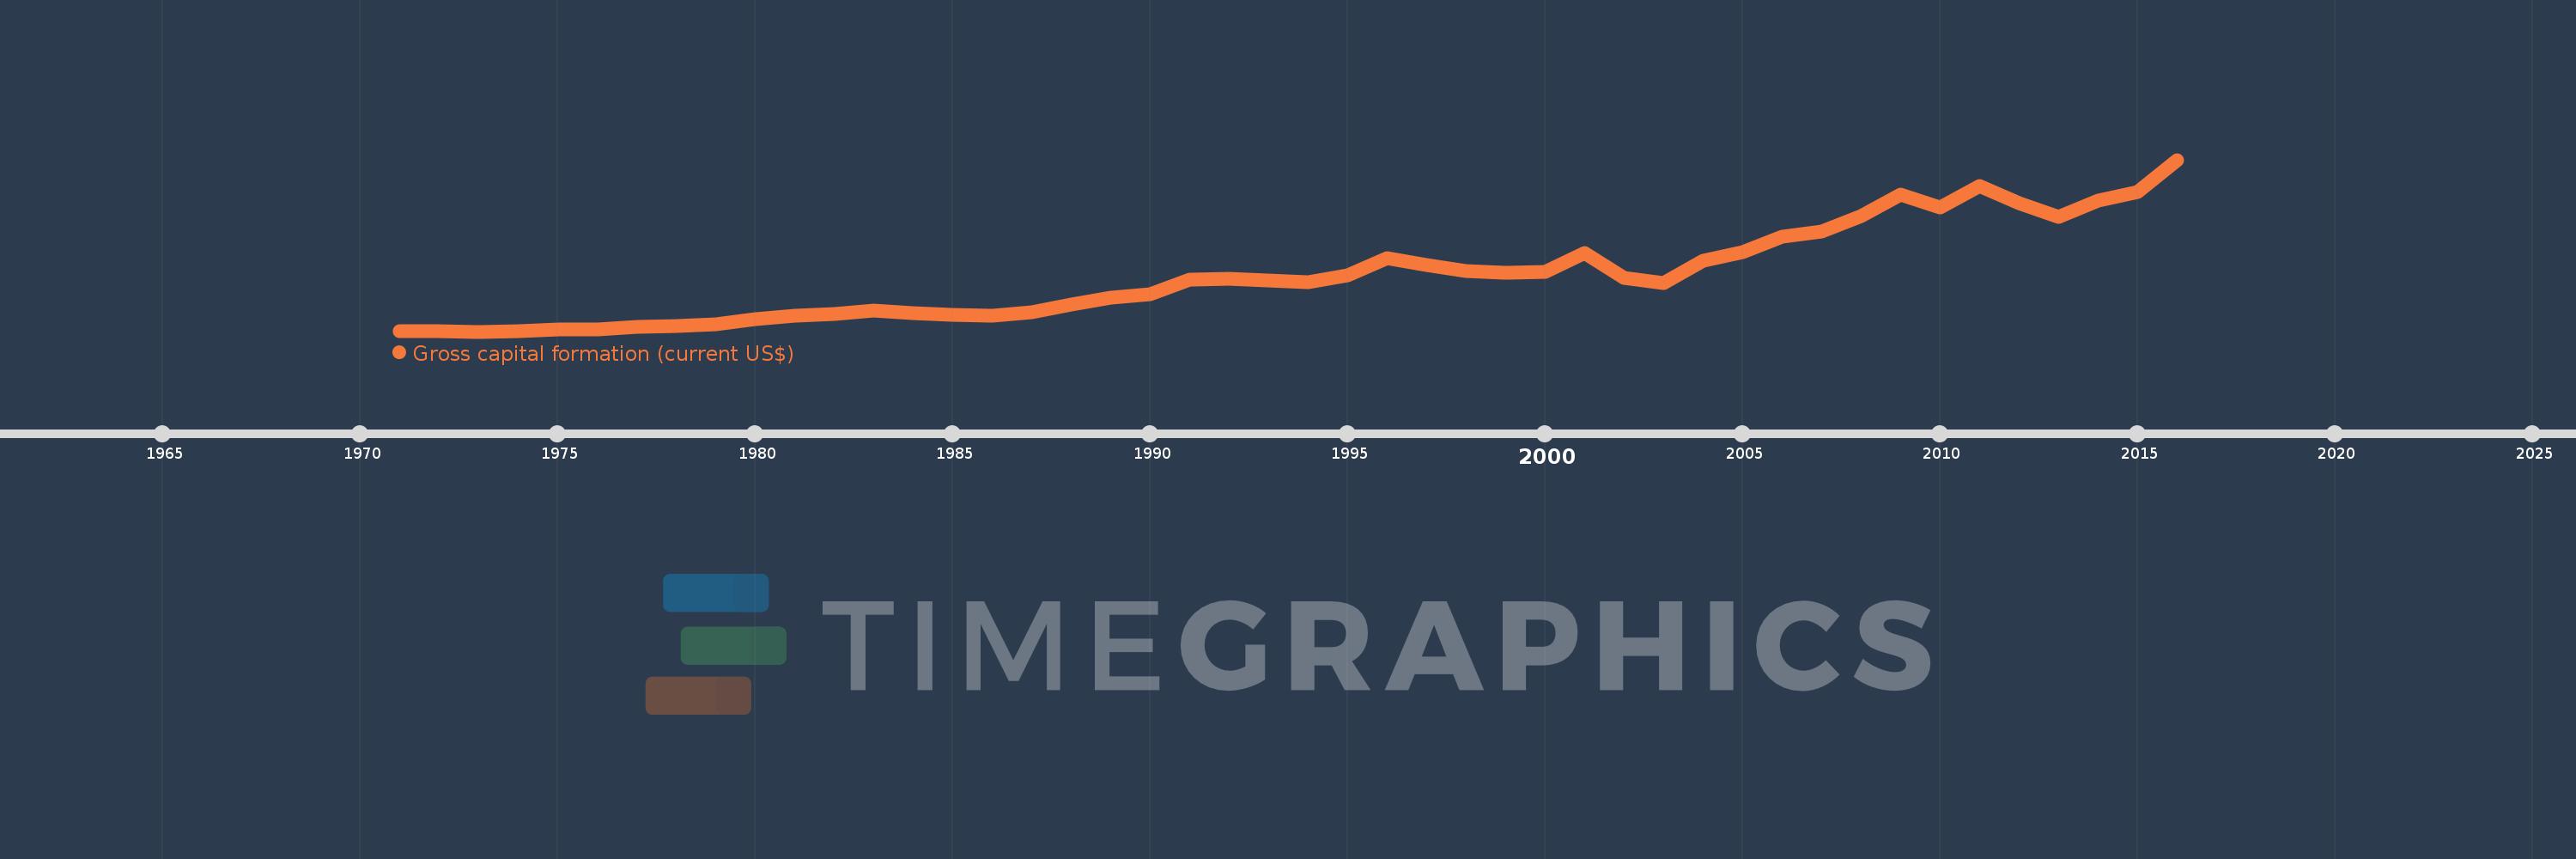
Gross capital formation (current US$)
2016,2015,2014,2013,2012,2011,2010,2009,2008,2007,2006,2005,2004,2003,2002,2001,2000,1999,1998,1997,1996,1995,1994,1993,1992,1991,1990,1989,1988,1987,1986,1985,1984,1983,1982,1981,1980,1979,1978,1977,1976,1975,1974,1973,1972,1971
Cette statistique dans les autres pays:
AfghanistanAlbaniaAlgeriaAngolaAntigua and BarbudaArab WorldArgentinaArmeniaArubaAustraliaAustriaAzerbaijanBahamas, TheBahrainBangladeshBarbadosBelarusBelgiumBelizeBeninBermudaBhutanBoliviaBosnia and HerzegovinaBotswanaBrazilBrunei DarussalamBulgariaBurkina FasoBurundiCabo VerdeCambodiaCameroonCanadaCaribbean small statesCentral African RepublicCentral Europe and the BalticsChadChileChinaColombiaComorosCongo, Dem. Rep.Congo, Rep.Costa RicaCote d'IvoireCroatiaCubaCyprusCzech RepublicDenmarkDjiboutiDominicaDominican RepublicEarly-demographic dividendEast Asia & PacificEast Asia & Pacific (excluding high income)East Asia & Pacific (IDA & IBRD countries)EcuadorEgypt, Arab Rep.El SalvadorEquatorial GuineaEritreaEstoniaEthiopiaEuro areaEurope & Central AsiaEurope & Central Asia (excluding high income)Europe & Central Asia (IDA & IBRD countries)European UnionFaroe IslandsFijiFinlandFragile and conflict affected situationsFranceGabonGambia, TheGeorgiaGermanyGhanaGreeceGrenadaGuatemalaGuineaGuinea-BissauGuyanaHaitiHeavily indebted poor countries (HIPC)High incomeHondurasHong Kong SAR, ChinaHungaryIBRD onlyIcelandIDA & IBRD totalIDA blendIDA onlyIDA totalIndiaIndonesiaIran, Islamic Rep.IraqIrelandIsraelItalyJamaicaJapanJordanKazakhstanKenyaKiribatiKorea, Rep.KosovoKuwaitKyrgyz RepublicLao PDRLate-demographic dividendLatin America & Caribbean Latin America & Caribbean (excluding high income)Latin America & the Caribbean (IDA & IBRD countries)LatviaLeast developed countries: UN classificationLebanonLesothoLiberiaLibyaLithuaniaLow & middle incomeLow incomeLower middle incomeLuxembourgMacao SAR, ChinaMacedonia, FYRMadagascarMalawiMalaysiaMaldivesMaliMaltaMauritaniaMauritiusMexicoMicronesia, Fed. Sts.Middle East & North AfricaMiddle East & North Africa (excluding high income)Middle East & North Africa (IDA & IBRD countries)Middle incomeMoldovaMongoliaMontenegroMoroccoMozambiqueNamibiaNepalNetherlandsNew CaledoniaNew ZealandNicaraguaNigerNigeriaNorth AmericaNorwayOECD membersOmanOther small statesPakistanPanamaPapua New GuineaParaguayPeruPhilippinesPolandPortugalPost-demographic dividendPre-demographic dividendPuerto RicoQatarRomaniaRussian FederationRwandaSaudi ArabiaSenegalSerbiaSeychellesSierra LeoneSingaporeSlovak RepublicSloveniaSmall statesSolomon IslandsSouth AfricaSouth AsiaSouth Asia (IDA & IBRD)South SudanSpainSri LankaSt. Kitts and NevisSt. LuciaSt. Vincent and the GrenadinesSub-Saharan Africa Sub-Saharan Africa (excluding high income)Sub-Saharan Africa (IDA & IBRD countries)SudanSurinameSwazilandSwedenSwitzerlandSyrian Arab RepublicTajikistanTanzaniaThailandTimor-LesteTogoTongaTrinidad and TobagoTunisiaTurkeyTurkmenistanUgandaUkraineUnited Arab EmiratesUnited KingdomUnited StatesUpper middle incomeUruguayUzbekistanVanuatuVenezuela, RBVietnamWest Bank and GazaWorldYemen, Rep.ZambiaZimbabwe La ligne de temps
Cette échelle de temps montre un graphique de 1971 année à 2016 année Malta. Les données jusqu'à 1970 année ne sont pas présentés. Quantité d'observations actuelles selon dates: 46.
Source (désignation):
Les indicateurs du développement mondiale
Source (organisation):
World Bank national accounts data, and OECD National Accounts data files.
Catégories:
Economy & Growth
Dernière mise à jour
23 avr. 2017
Les indicateurs de changement de valeurs selon les années
Minimum:
67.552 mln.
1 janv. 1973
Maximum:
2.424 mds
1 janv. 2016
Pour la date d''observation
Valeur
Changement absolu
Le changement par rapport à la valeur précédente
1 janv. 1971
75.284 mln.
+75.284 mln.
0.0%
1 janv. 1972
70.489 mln.
-4.794 mln.
-6.37%
1 janv. 1973
67.552 mln.
-2.937 mln.
-4.17%
1 janv. 1974
70.071 mln.
+2.519 mln.
3.73%
1 janv. 1975
93.589 mln.
+23.517 mln.
33.56%
1 janv. 1976
102.338 mln.
+8.749 mln.
9.35%
1 janv. 1977
133.188 mln.
+30.85 mln.
30.15%
1 janv. 1978
149.013 mln.
+15.825 mln.
11.88%
1 janv. 1979
170.758 mln.
+21.745 mln.
14.59%
1 janv. 1980
234.02 mln.
+63.263 mln.
37.05%
1 janv. 1981
282.265 mln.
+48.245 mln.
20.62%
1 janv. 1982
308.833 mln.
+26.568 mln.
9.41%
1 janv. 1983
357.165 mln.
+48.332 mln.
15.65%
1 janv. 1984
320.443 mln.
-36.722 mln.
-10.28%
1 janv. 1985
292.114 mln.
-28.329 mln.
-8.84%
1 janv. 1986
288.184 mln.
-3.93 mln.
-1.35%
1 janv. 1987
335.679 mln.
+47.494 mln.
16.48%
1 janv. 1988
441.989 mln.
+106.311 mln.
31.67%
1 janv. 1989
533.275 mln.
+91.286 mln.
20.65%
1 janv. 1990
575.262 mln.
+41.987 mln.
7.87%
1 janv. 1991
780.112 mln.
+204.85 mln.
35.61%
1 janv. 1992
796.412 mln.
+16.301 mln.
2.09%
1 janv. 1993
763.88 mln.
-32.533 mln.
-4.08%
1 janv. 1994
741.689 mln.
-22.191 mln.
-2.91%
1 janv. 1995
842.527 mln.
+100.839 mln.
13.6%
1 janv. 1996
1.069 mds
+226.661 mln.
26.9%
1 janv. 1997
984.516 mln.
-84.671 mln.
-7.92%
1 janv. 1998
902.903 mln.
-81.614 mln.
-8.29%
1 janv. 1999
871.92 mln.
-30.983 mln.
-3.43%
1 janv. 2000
890.121 mln.
+18.201 mln.
2.09%
1 janv. 2001
1.145 mds
+255.284 mln.
28.68%
1 janv. 2002
803.11 mln.
-342.295 mln.
-29.88%
1 janv. 2003
736.462 mln.
-66.648 mln.
-8.3%
1 janv. 2004
1.04 mds
+303.939 mln.
41.27%
1 janv. 2005
1.158 mds
+117.796 mln.
11.32%
1 janv. 2006
1.365 mds
+206.808 mln.
17.86%
1 janv. 2007
1.438 mds
+72.833 mln.
5.34%
1 janv. 2008
1.653 mds
+214.777 mln.
14.94%
1 janv. 2009
1.947 mds
+294.214 mln.
17.8%
1 janv. 2010
1.771 mds
-175.92 mln.
-9.04%
1 janv. 2011
2.064 mds
+292.932 mln.
16.54%
1 janv. 2012
1.833 mds
-230.786 mln.
-11.18%
1 janv. 2013
1.645 mds
-187.803 mln.
-10.25%
1 janv. 2014
1.864 mds
+218.794 mln.
13.3%
1 janv. 2015
1.98 mds
+116.449 mln.
6.25%
1 janv. 2016
2.424 mds
+443.813 mln.
22.41%
Classement des pays selon les statistiques actuelles par années


Commentaires: