29
/fr/
fr
AIzaSyAYiBZKx7MnpbEhh9jyipgxe19OcubqV5w
April 1, 2024
191404
Malta
MLT
true
2
1
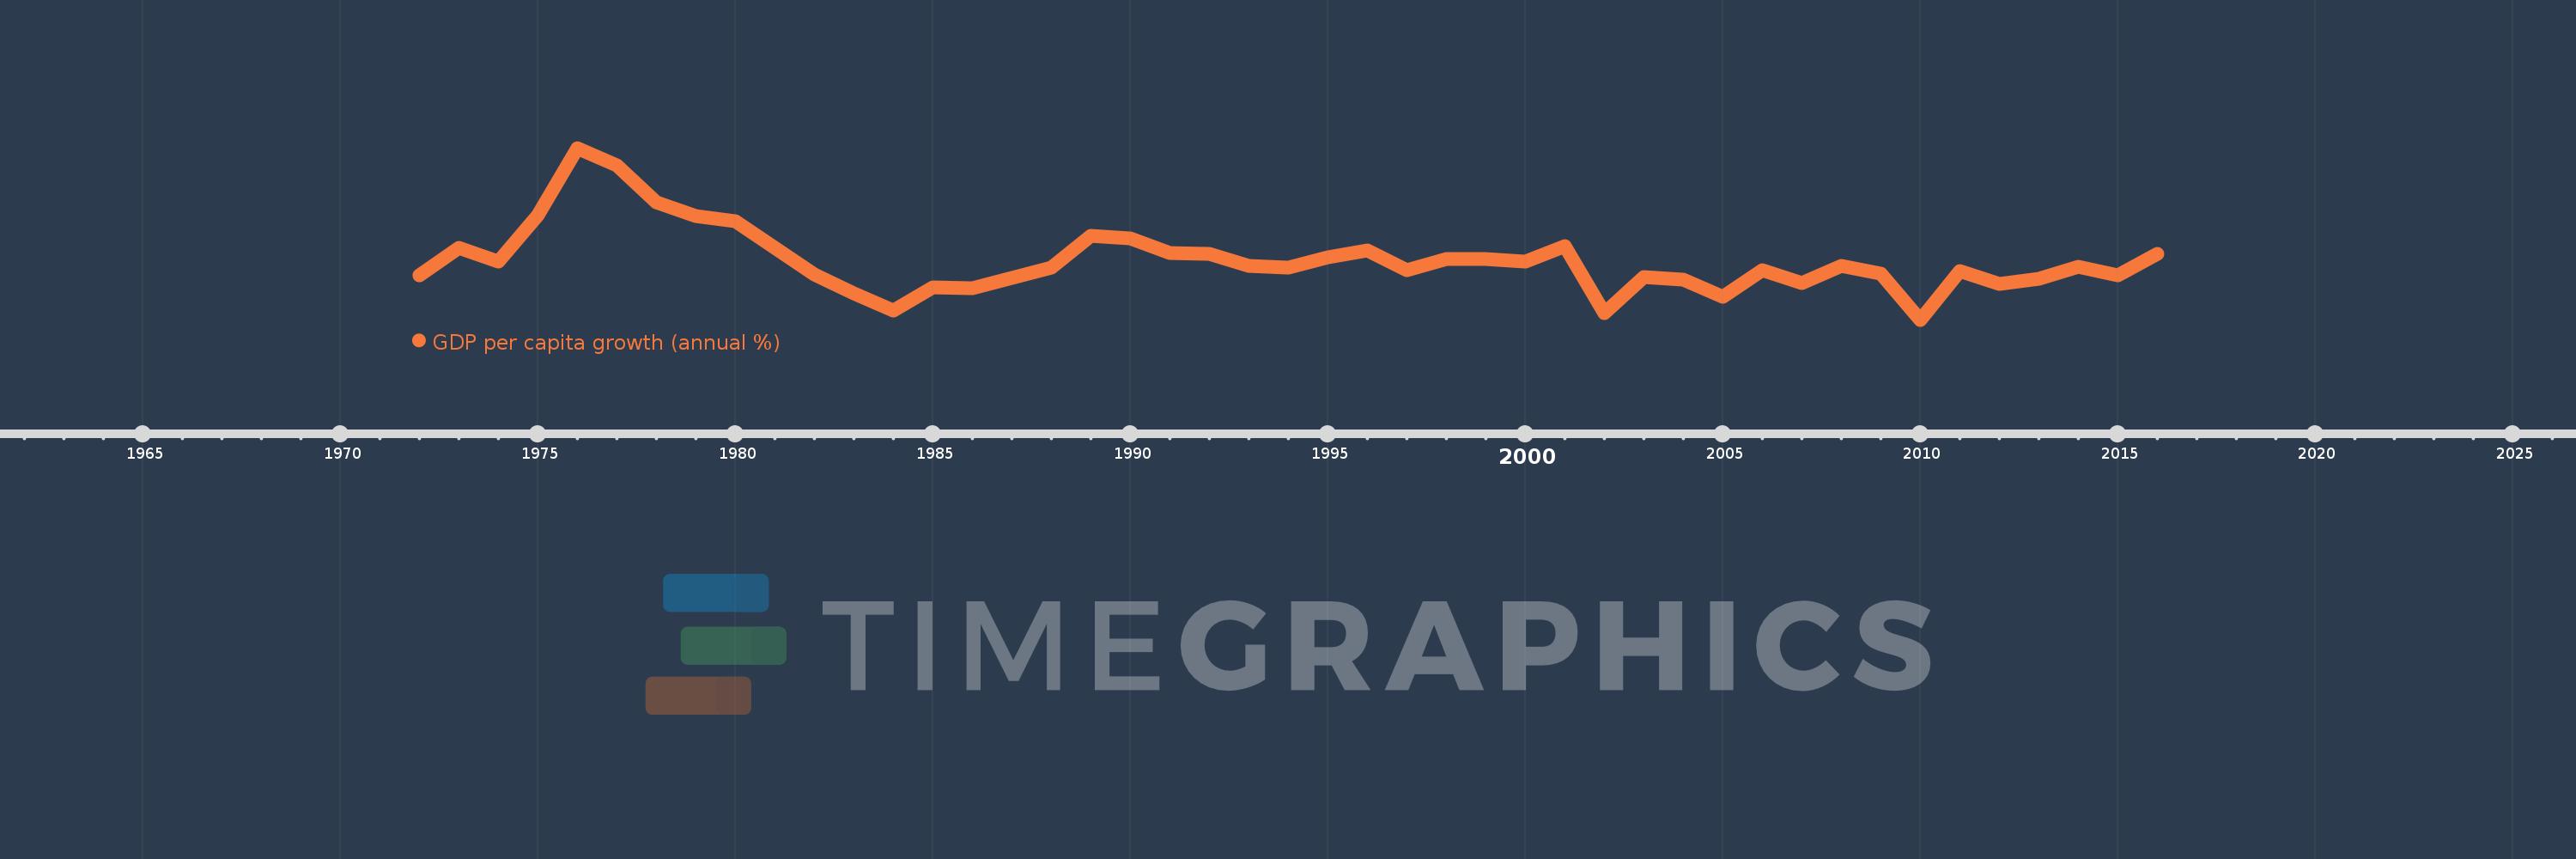
GDP per capita growth (annual %)
2016,2015,2014,2013,2012,2011,2010,2009,2008,2007,2006,2005,2004,2003,2002,2001,2000,1999,1998,1997,1996,1995,1994,1993,1992,1991,1990,1989,1988,1987,1986,1985,1984,1983,1982,1981,1980,1979,1978,1977,1976,1975,1974,1973,1972
Cette statistique dans les autres pays:
AfghanistanAlbaniaAlgeriaAndorraAngolaAntigua and BarbudaArab WorldArgentinaArmeniaArubaAustraliaAustriaAzerbaijanBahamas, TheBahrainBangladeshBarbadosBelarusBelgiumBelizeBeninBermudaBhutanBoliviaBosnia and HerzegovinaBotswanaBrazilBrunei DarussalamBulgariaBurkina FasoBurundiCabo VerdeCambodiaCameroonCanadaCaribbean small statesCayman IslandsCentral African RepublicCentral Europe and the BalticsChadChannel IslandsChileChinaColombiaComorosCongo, Dem. Rep.Congo, Rep.Costa RicaCote d'IvoireCroatiaCubaCyprusCzech RepublicDenmarkDjiboutiDominicaDominican RepublicEarly-demographic dividendEast Asia & PacificEast Asia & Pacific (excluding high income)East Asia & Pacific (IDA & IBRD countries)EcuadorEgypt, Arab Rep.El SalvadorEquatorial GuineaEritreaEstoniaEthiopiaEuro areaEurope & Central AsiaEurope & Central Asia (excluding high income)Europe & Central Asia (IDA & IBRD countries)European UnionFijiFinlandFragile and conflict affected situationsFranceFrench PolynesiaGabonGambia, TheGeorgiaGermanyGhanaGreeceGreenlandGrenadaGuatemalaGuineaGuinea-BissauGuyanaHaitiHeavily indebted poor countries (HIPC)High incomeHondurasHong Kong SAR, ChinaHungaryIBRD onlyIcelandIDA & IBRD totalIDA blendIDA onlyIDA totalIndiaIndonesiaIran, Islamic Rep.IraqIrelandIsle of ManIsraelItalyJamaicaJapanJordanKazakhstanKenyaKiribatiKorea, Rep.KosovoKuwaitKyrgyz RepublicLao PDRLate-demographic dividendLatin America & Caribbean Latin America & Caribbean (excluding high income)Latin America & the Caribbean (IDA & IBRD countries)LatviaLeast developed countries: UN classificationLebanonLesothoLiberiaLibyaLiechtensteinLithuaniaLow & middle incomeLow incomeLower middle incomeLuxembourgMacao SAR, ChinaMacedonia, FYRMadagascarMalawiMalaysiaMaldivesMaliMaltaMarshall IslandsMauritaniaMauritiusMexicoMicronesia, Fed. Sts.Middle East & North AfricaMiddle East & North Africa (excluding high income)Middle East & North Africa (IDA & IBRD countries)Middle incomeMoldovaMonacoMongoliaMontenegroMoroccoMozambiqueMyanmarNamibiaNauruNepalNetherlandsNew CaledoniaNew ZealandNicaraguaNigerNigeriaNorth AmericaNorwayOECD membersOmanOther small statesPacific island small statesPakistanPalauPanamaPapua New GuineaParaguayPeruPhilippinesPolandPortugalPost-demographic dividendPre-demographic dividendPuerto RicoQatarRomaniaRussian FederationRwandaSamoaSan MarinoSao Tome and PrincipeSaudi ArabiaSenegalSerbiaSeychellesSierra LeoneSingaporeSlovak RepublicSloveniaSmall statesSolomon IslandsSomaliaSouth AfricaSouth AsiaSouth Asia (IDA & IBRD)South SudanSpainSri LankaSt. Kitts and NevisSt. LuciaSt. Vincent and the GrenadinesSub-Saharan Africa Sub-Saharan Africa (excluding high income)Sub-Saharan Africa (IDA & IBRD countries)SudanSurinameSwazilandSwedenSwitzerlandSyrian Arab RepublicTajikistanTanzaniaThailandTimor-LesteTogoTongaTrinidad and TobagoTunisiaTurkeyTurkmenistanTuvaluUgandaUkraineUnited Arab EmiratesUnited KingdomUnited StatesUpper middle incomeUruguayUzbekistanVanuatuVenezuela, RBVietnamVirgin Islands (U.S.)West Bank and GazaWorldYemen, Rep.ZambiaZimbabwe La ligne de temps
Cette échelle de temps montre un graphique de 1972 année à 2016 année Malta. Les données jusqu'à 1971 année ne sont pas présentés. Quantité d'observations actuelles selon dates: 45.
Source (désignation):
Les indicateurs du développement mondiale
Source (organisation):
World Bank national accounts data, and OECD National Accounts data files.
Catégories:
Economy & Growth
Dernière mise à jour
23 avr. 2017
Les indicateurs de changement de valeurs selon les années
Minimum:
-3.195
1 janv. 2010
Maximum:
18.685
1 janv. 1976
Pour la date d''observation
Valeur
Changement absolu
Le changement par rapport à la valeur précédente
1 janv. 1972
2.437
+2.437
0.0%
1 janv. 1973
5.926
+3.489
143.15%
1 janv. 1974
4.232
-1.694
-28.58%
1 janv. 1975
10.111
+5.878
138.89%
1 janv. 1976
18.685
+8.575
84.81%
1 janv. 1977
16.423
-2.262
-12.11%
1 janv. 1978
11.747
-4.676
-28.47%
1 janv. 1979
10.01
-1.737
-14.79%
1 janv. 1980
9.376
-0.634
-6.33%
1 janv. 1981
5.933
-3.443
-36.72%
1 janv. 1982
2.555
-3.378
-56.94%
1 janv. 1983
0.114
-2.441
-95.54%
1 janv. 1984
-2.003
-2.117
-1.86 milles%
1 janv. 1985
0.921
+2.925
-145.99%
1 janv. 1986
0.799
-0.122
-13.29%
1 janv. 1987
2.164
+1.365
170.86%
1 janv. 1988
3.396
+1.232
56.95%
1 janv. 1989
7.528
+4.132
121.66%
1 janv. 1990
7.131
-0.396
-5.27%
1 janv. 1991
5.257
-1.875
-26.29%
1 janv. 1992
5.2
-0.057
-1.08%
1 janv. 1993
3.667
-1.533
-29.48%
1 janv. 1994
3.494
-0.173
-4.72%
1 janv. 1995
4.722
+1.228
35.13%
1 janv. 1996
5.627
+0.905
19.18%
1 janv. 1997
3.15
-2.477
-44.03%
1 janv. 1998
4.542
+1.392
44.2%
1 janv. 1999
4.491
-0.051
-1.13%
1 janv. 2000
4.211
-0.28
-6.23%
1 janv. 2001
6.209
+1.998
47.46%
1 janv. 2002
-2.378
-8.587
-138.29%
1 janv. 2003
2.218
+4.596
-193.28%
1 janv. 2004
1.872
-0.346
-15.62%
1 janv. 2005
-0.229
-2.1
-112.23%
1 janv. 2006
3.124
+3.353
-1.46 milles%
1 janv. 2007
1.458
-1.666
-53.32%
1 janv. 2008
3.624
+2.166
148.52%
1 janv. 2009
2.676
-0.948
-26.16%
1 janv. 2010
-3.195
-5.871
-219.38%
1 janv. 2011
3.035
+6.23
-195.01%
1 janv. 2012
1.392
-1.643
-54.13%
1 janv. 2013
2.07
+0.677
48.66%
1 janv. 2014
3.505
+1.435
69.35%
1 janv. 2015
2.495
-1.01
-28.82%
1 janv. 2016
5.178
+2.683
107.54%
Classement des pays selon les statistiques actuelles par années


Commentaires: