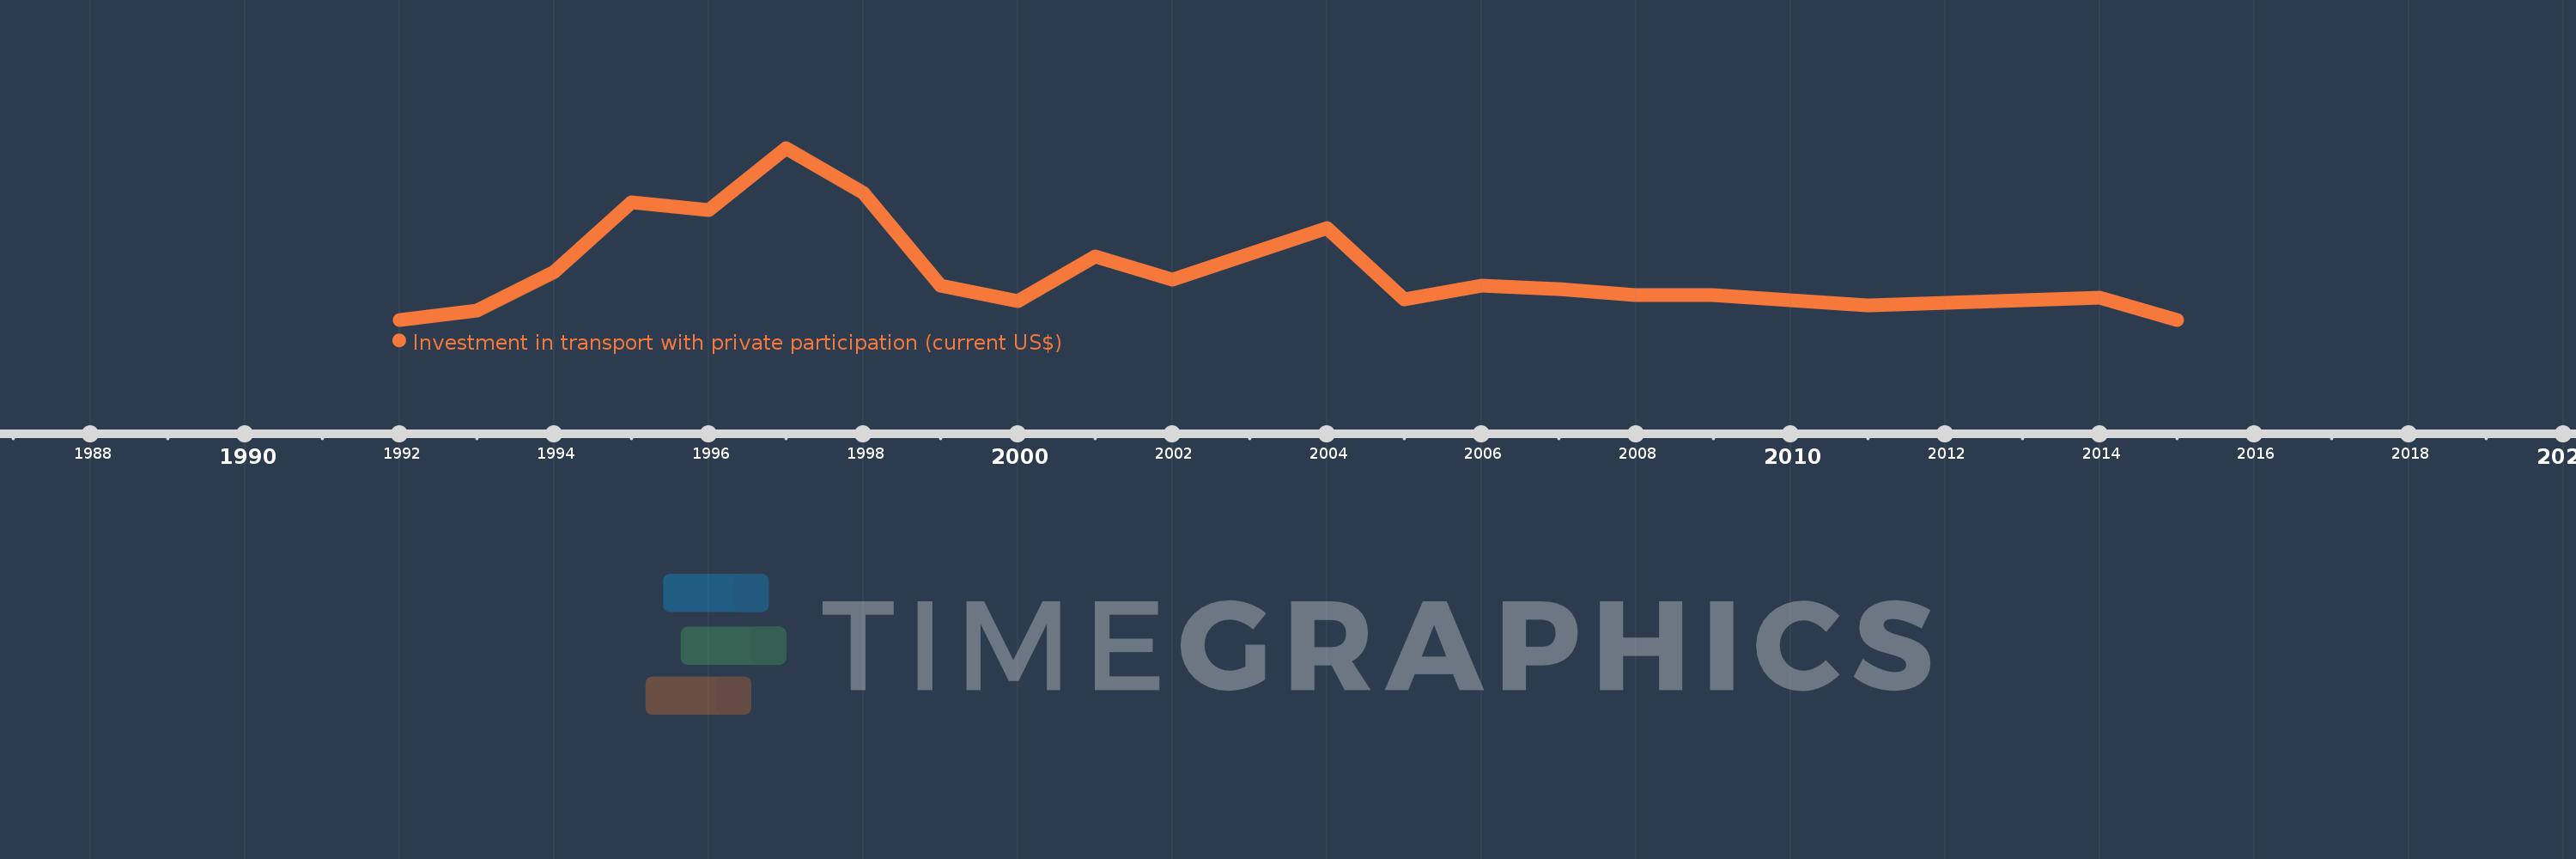
Cette échelle de temps montre un graphique de 1992 année à 2015 année Malaysia. Les données jusqu'à 1991 année ne sont pas présentés. Quantité d'observations actuelles selon dates: 20.
Source (désignation):
Les indicateurs du développement mondiale
Source (organisation):
World Bank, Private Participation in Infrastructure Project Database (http://ppi.worldbank.org).
Catégories:
Infrastructure, Private Sector
Dernière mise à jour
23 avr. 2017
Les indicateurs de changement de valeurs selon les années
En moyenne:
859.323 mln.
Minimum:
0.0
1 janv. 1992
Maximum:
2.948 mds
1 janv. 1997
Pour la date d''observation
Valeur
Changement absolu
Le changement par rapport à la valeur précédente
1 janv. 1992
0.0
0.0
0.0%
1 janv. 1993
160.0 mln.
+160.0 mln.
%
1 janv. 1994
814.0 mln.
+654.0 mln.
408.75%
1 janv. 1995
2.011 mds
+1.197 mds
147.0%
1 janv. 1996
1.889 mds
-121.6 mln.
-6.05%
1 janv. 1997
2.948 mds
+1.059 mds
56.07%
1 janv. 1998
2.182 mds
-765.7 mln.
-25.97%
1 janv. 1999
591.9 mln.
-1.591 mds
-72.88%
1 janv. 2000
314.2 mln.
-277.7 mln.
-46.92%
1 janv. 2001
1.08 mds
+765.5 mln.
243.63%
1 janv. 2002
684.3 mln.
-395.4 mln.
-36.62%
1 janv. 2004
1.57 mds
+885.6 mln.
129.42%
1 janv. 2005
342.11 mln.
-1.228 mds
-78.21%
1 janv. 2006
586.95 mln.
+244.84 mln.
71.57%
1 janv. 2007
531.0 mln.
-55.95 mln.
-9.53%
1 janv. 2008
423.0 mln.
-108.0 mln.
-20.34%
1 janv. 2009
425.0 mln.
+2.0 mln.
0.47%
1 janv. 2011
253.3 mln.
-171.7 mln.
-40.4%
1 janv. 2014
381.0 mln.
+127.7 mln.
50.41%
1 janv. 2015
0.0
-381.0 mln.
-100.0%
Classement des pays selon les statistiques actuelles par années
