29
/fr/
fr
AIzaSyAYiBZKx7MnpbEhh9jyipgxe19OcubqV5w
April 1, 2024
187329
Malawi
MWI
true
2
1
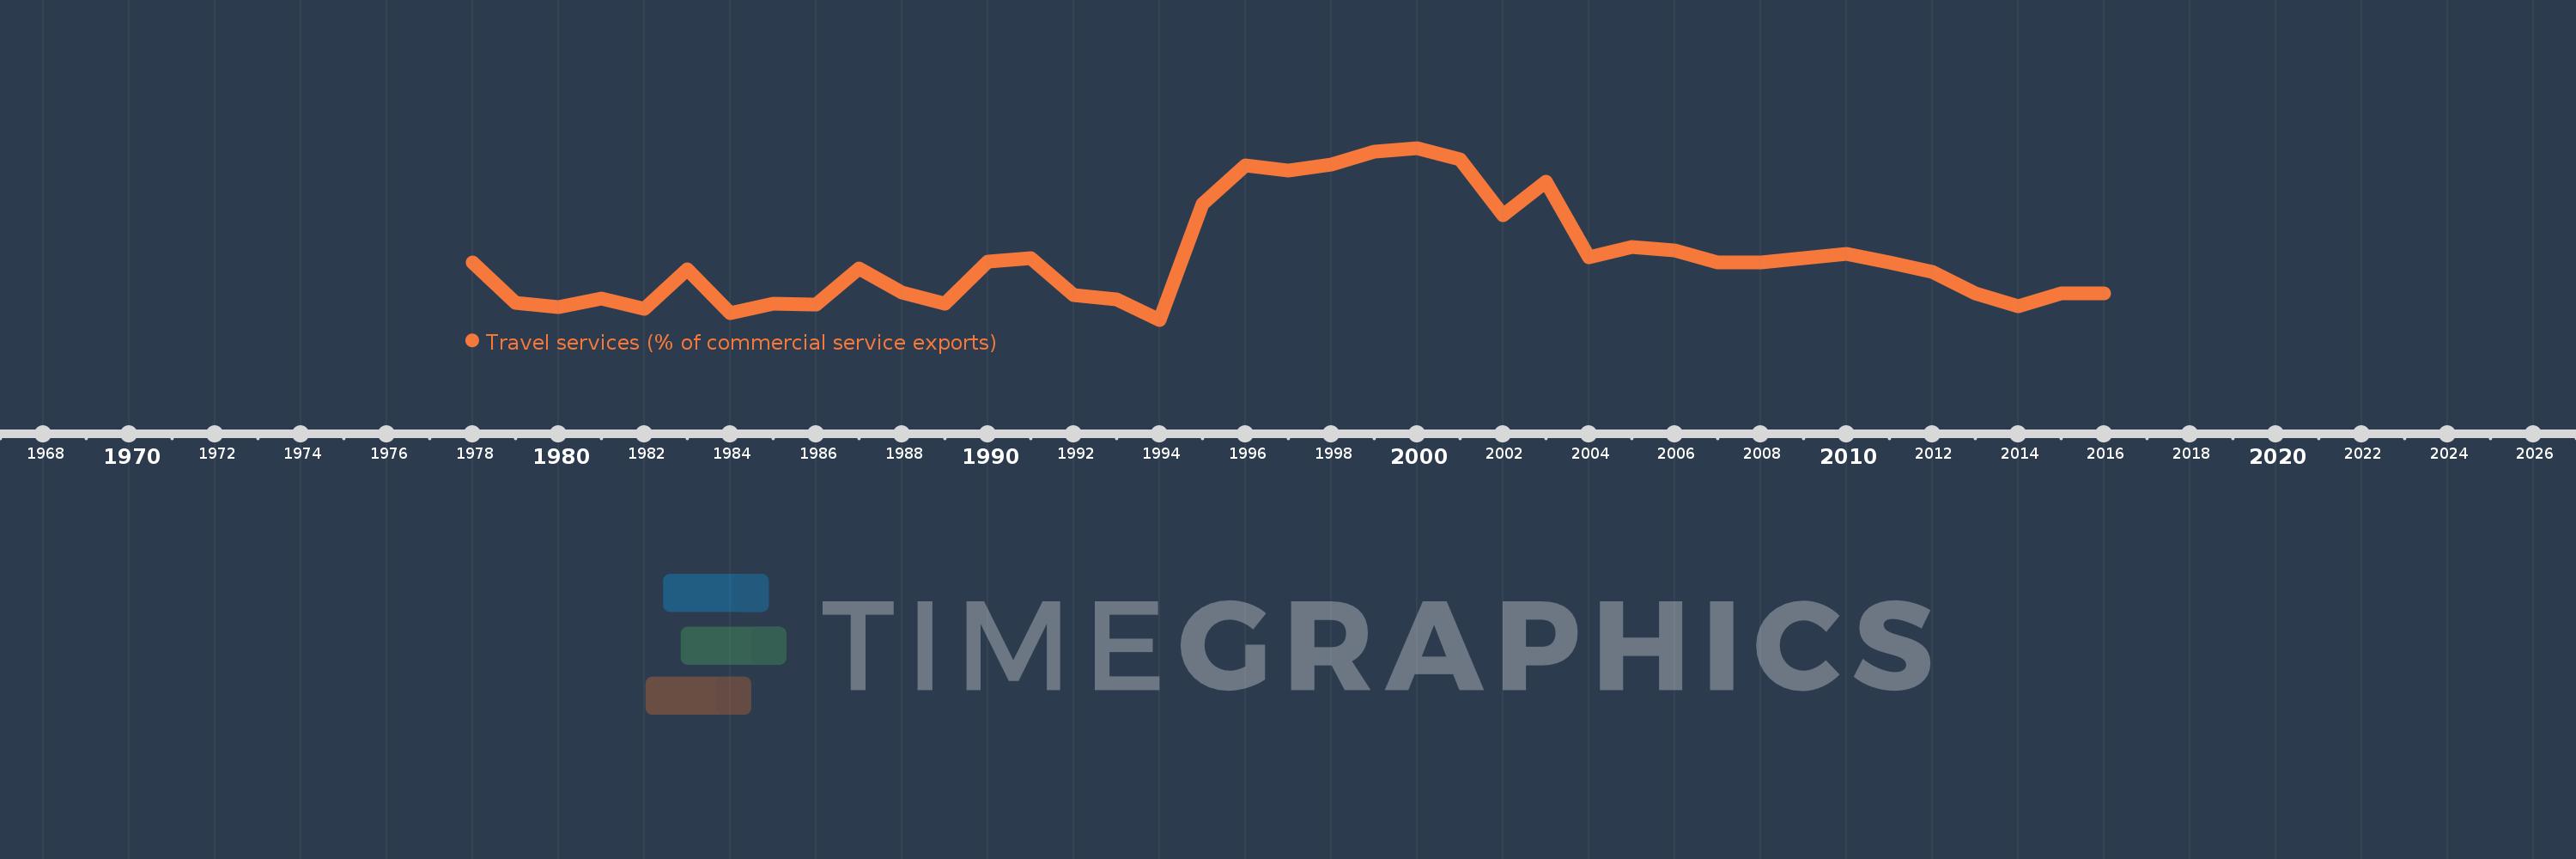
Travel services (% of commercial service exports)
2016,2015,2014,2013,2012,2011,2010,2009,2008,2007,2006,2005,2004,2003,2002,2001,2000,1999,1998,1997,1996,1995,1994,1993,1992,1991,1990,1989,1988,1987,1986,1985,1984,1983,1982,1981,1980,1979,1978
Cette statistique dans les autres pays:
AfghanistanAlbaniaAlgeriaAngolaAntigua and BarbudaArab WorldArgentinaArmeniaArubaAustraliaAustriaAzerbaijanBahamas, TheBahrainBangladeshBarbadosBelarusBelgiumBelizeBeninBermudaBhutanBoliviaBosnia and HerzegovinaBotswanaBrazilBrunei DarussalamBulgariaBurkina FasoBurundiCabo VerdeCambodiaCameroonCanadaCaribbean small statesCentral African RepublicCentral Europe and the BalticsChadChileChinaColombiaComorosCongo, Dem. Rep.Congo, Rep.Costa RicaCote d'IvoireCroatiaCuracaoCyprusCzech RepublicDenmarkDjiboutiDominicaDominican RepublicEarly-demographic dividendEast Asia & PacificEast Asia & Pacific (excluding high income)East Asia & Pacific (IDA & IBRD countries)EcuadorEgypt, Arab Rep.El SalvadorEritreaEstoniaEthiopiaEuro areaEurope & Central AsiaEurope & Central Asia (excluding high income)Europe & Central Asia (IDA & IBRD countries)European UnionFaroe IslandsFijiFinlandFragile and conflict affected situationsFranceFrench PolynesiaGabonGambia, TheGeorgiaGermanyGhanaGreeceGrenadaGuatemalaGuineaGuinea-BissauGuyanaHaitiHeavily indebted poor countries (HIPC)High incomeHondurasHong Kong SAR, ChinaHungaryIBRD onlyIcelandIDA & IBRD totalIDA onlyIDA totalIndiaIndonesiaIran, Islamic Rep.IraqIrelandIsraelItalyJamaicaJapanJordanKazakhstanKenyaKiribatiKorea, Rep.KosovoKuwaitKyrgyz RepublicLao PDRLate-demographic dividendLatin America & Caribbean Latin America & Caribbean (excluding high income)Latin America & the Caribbean (IDA & IBRD countries)LatviaLeast developed countries: UN classificationLebanonLesothoLiberiaLibyaLithuaniaLow & middle incomeLow incomeLower middle incomeLuxembourgMacao SAR, ChinaMacedonia, FYRMadagascarMalawiMalaysiaMaldivesMaliMaltaMarshall IslandsMauritaniaMauritiusMexicoMicronesia, Fed. Sts.Middle East & North Africa (excluding high income)Middle East & North Africa (IDA & IBRD countries)Middle incomeMoldovaMongoliaMontenegroMoroccoMozambiqueMyanmarNamibiaNepalNetherlandsNew CaledoniaNew ZealandNicaraguaNigerNigeriaNorth AmericaNorwayOECD membersOmanOther small statesPacific island small statesPakistanPalauPanamaPapua New GuineaParaguayPeruPhilippinesPolandPortugalPost-demographic dividendPre-demographic dividendQatarRomaniaRussian FederationRwandaSamoaSao Tome and PrincipeSaudi ArabiaSenegalSerbiaSeychellesSierra LeoneSingaporeSint Maarten (Dutch part)Slovak RepublicSloveniaSmall statesSolomon IslandsSouth AfricaSouth AsiaSouth Asia (IDA & IBRD)South SudanSpainSri LankaSt. Kitts and NevisSt. LuciaSt. Vincent and the GrenadinesSub-Saharan Africa Sub-Saharan Africa (excluding high income)Sub-Saharan Africa (IDA & IBRD countries)SudanSurinameSwazilandSwedenSwitzerlandSyrian Arab RepublicTajikistanTanzaniaThailandTimor-LesteTogoTongaTrinidad and TobagoTunisiaTurkeyTuvaluUgandaUkraineUnited KingdomUnited StatesUpper middle incomeUruguayVanuatuVenezuela, RBWest Bank and GazaWorldYemen, Rep.ZambiaZimbabwe La ligne de temps
Cette échelle de temps montre un graphique de 1978 année à 2016 année Malawi. Les données jusqu'à 1977 année ne sont pas présentés. Quantité d'observations actuelles selon dates: 39.
Source (désignation):
Les indicateurs du développement mondiale
Source (organisation):
International Monetary Fund, Balance of Payments Statistics Yearbook and data files.
Catégories:
Private Sector, Trade
Dernière mise à jour
23 avr. 2017
Les indicateurs de changement de valeurs selon les années
Minimum:
22.745
1 janv. 1994
Maximum:
78.128
1 janv. 2000
Pour la date d''observation
Valeur
Changement absolu
Le changement par rapport à la valeur précédente
1 janv. 1978
41.322
+41.322
0.0%
1 janv. 1979
28.241
-13.082
-31.66%
1 janv. 1980
26.761
-1.48
-5.24%
1 janv. 1981
29.457
+2.697
10.08%
1 janv. 1982
26.343
-3.115
-10.57%
1 janv. 1983
39.116
+12.773
48.49%
1 janv. 1984
24.852
-14.264
-36.47%
1 janv. 1985
28.01
+3.158
12.71%
1 janv. 1986
27.578
-0.432
-1.54%
1 janv. 1987
39.305
+11.726
42.52%
1 janv. 1988
31.579
-7.726
-19.66%
1 janv. 1989
27.817
-3.762
-11.91%
1 janv. 1990
41.568
+13.75
49.43%
1 janv. 1991
42.6
+1.032
2.48%
1 janv. 1992
30.648
-11.952
-28.06%
1 janv. 1993
29.211
-1.437
-4.69%
1 janv. 1994
22.745
-6.467
-22.14%
1 janv. 1995
60.097
+37.352
164.22%
1 janv. 1996
72.407
+12.311
20.48%
1 janv. 1997
70.945
-1.463
-2.02%
1 janv. 1998
72.748
+1.803
2.54%
1 janv. 1999
76.876
+4.128
5.67%
1 janv. 2000
78.128
+1.253
1.63%
1 janv. 2001
74.322
-3.806
-4.87%
1 janv. 2002
56.363
-17.959
-24.16%
1 janv. 2003
67.332
+10.969
19.46%
1 janv. 2004
42.963
-24.369
-36.19%
1 janv. 2005
46.272
+3.309
7.7%
1 janv. 2006
45.03
-1.243
-2.69%
1 janv. 2007
41.101
-3.929
-8.73%
1 janv. 2008
41.33
+0.229
0.56%
1 janv. 2009
42.687
+1.358
3.28%
1 janv. 2010
44.099
+1.411
3.31%
1 janv. 2011
41.254
-2.844
-6.45%
1 janv. 2012
38.187
-3.067
-7.44%
1 janv. 2013
31.111
-7.076
-18.53%
1 janv. 2014
27.099
-4.012
-12.89%
1 janv. 2015
31.21
+4.11
15.17%
1 janv. 2016
31.375
+0.166
0.53%
Classement des pays selon les statistiques actuelles par années


Commentaires: