29
/fr/
fr
AIzaSyAYiBZKx7MnpbEhh9jyipgxe19OcubqV5w
April 1, 2024
186615
Malawi
MWI
true
2
1
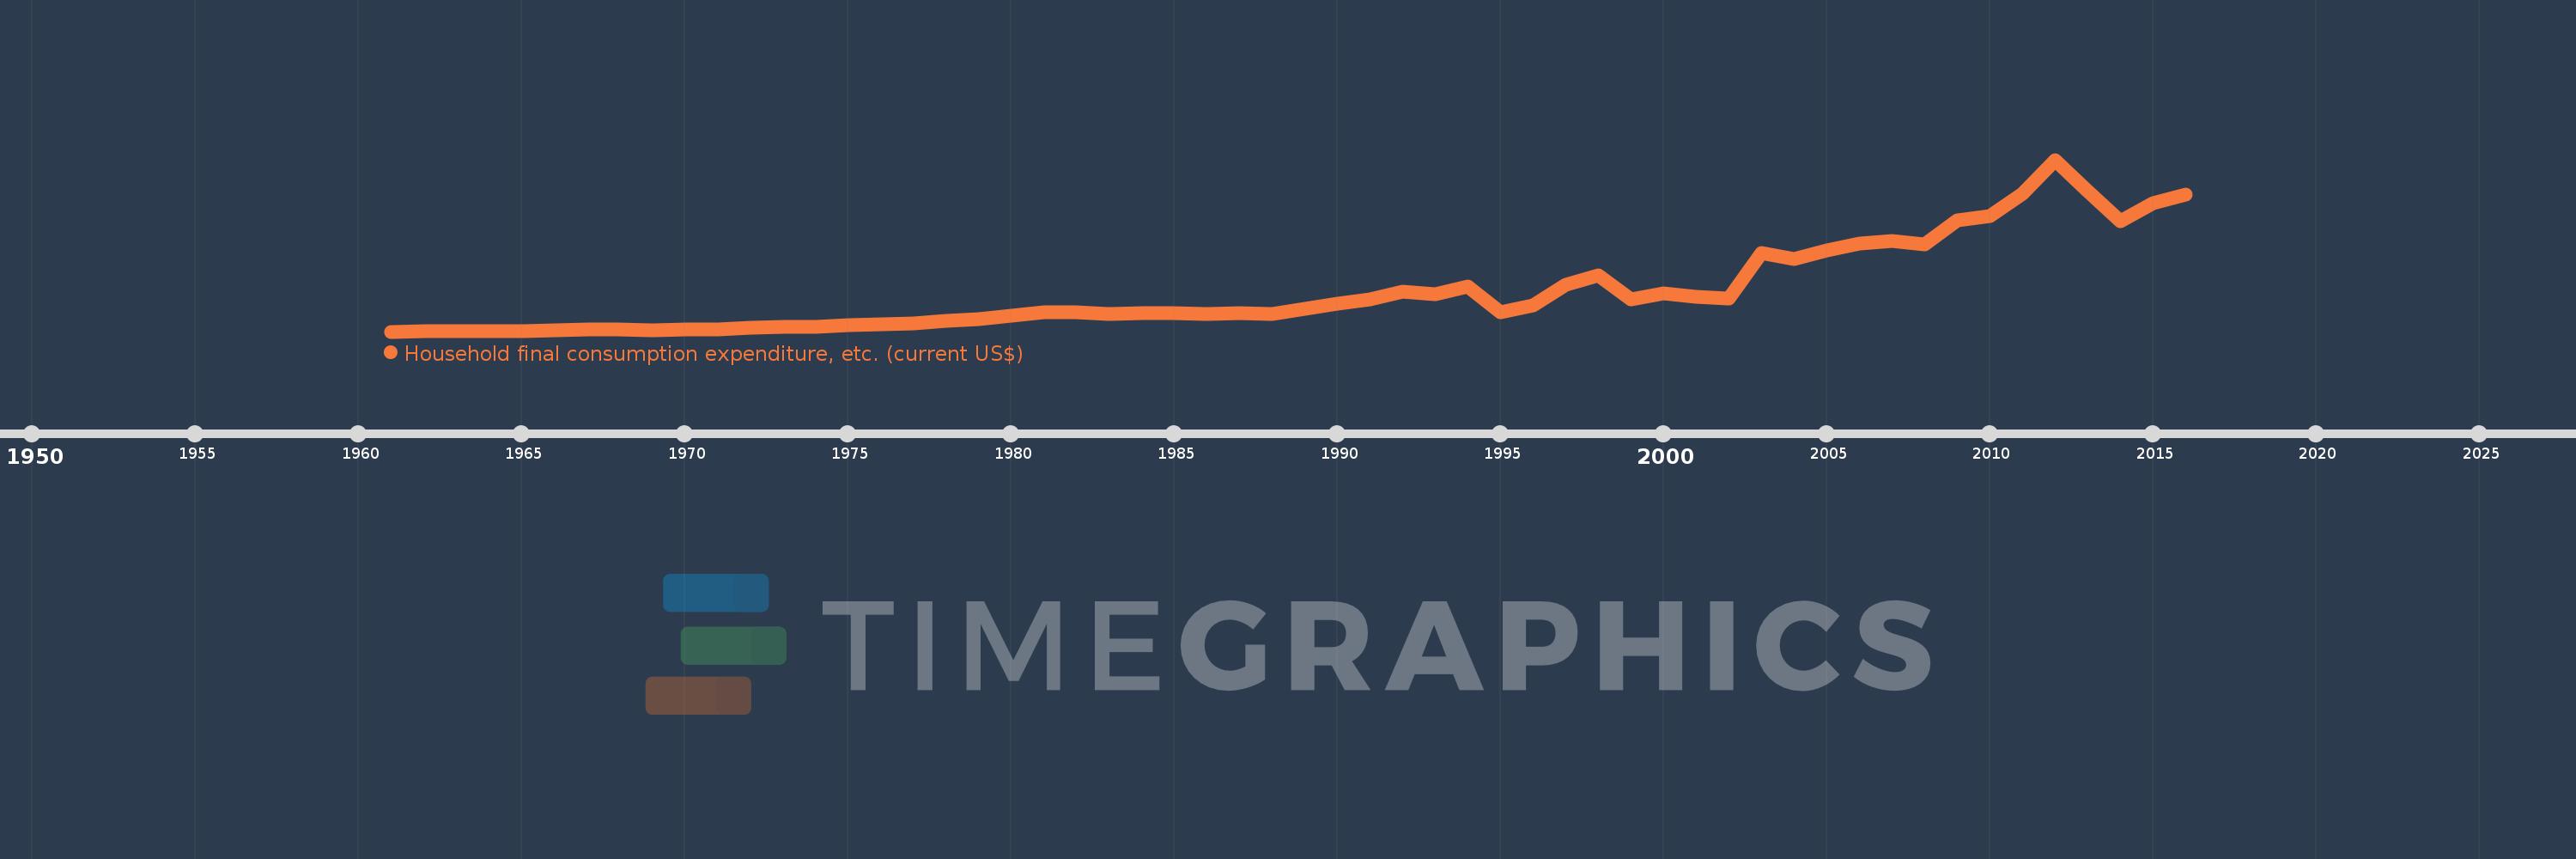
Household final consumption expenditure, etc. (current US$)
2016,2015,2014,2013,2012,2011,2010,2009,2008,2007,2006,2005,2004,2003,2002,2001,2000,1999,1998,1997,1996,1995,1994,1993,1992,1991,1990,1989,1988,1987,1986,1985,1984,1983,1982,1981,1980,1979,1978,1977,1976,1975,1974,1973,1972,1971,1970,1969,1968,1967,1966,1965,1964,1963,1962,1961
Cette statistique dans les autres pays:
AfghanistanAlbaniaAlgeriaAngolaAntigua and BarbudaArab WorldArgentinaArmeniaArubaAustraliaAustriaAzerbaijanBahamas, TheBahrainBangladeshBarbadosBelarusBelgiumBelizeBeninBermudaBhutanBoliviaBosnia and HerzegovinaBotswanaBrazilBrunei DarussalamBulgariaBurkina FasoBurundiCabo VerdeCambodiaCameroonCanadaCaribbean small statesCentral African RepublicCentral Europe and the BalticsChadChileChinaColombiaComorosCongo, Dem. Rep.Congo, Rep.Costa RicaCote d'IvoireCroatiaCubaCyprusCzech RepublicDenmarkDjiboutiDominicaDominican RepublicEarly-demographic dividendEast Asia & PacificEast Asia & Pacific (excluding high income)East Asia & Pacific (IDA & IBRD countries)EcuadorEgypt, Arab Rep.El SalvadorEquatorial GuineaEritreaEstoniaEthiopiaEuro areaEurope & Central AsiaEurope & Central Asia (excluding high income)Europe & Central Asia (IDA & IBRD countries)European UnionFaroe IslandsFijiFinlandFragile and conflict affected situationsFranceGabonGambia, TheGeorgiaGermanyGhanaGreeceGrenadaGuatemalaGuineaGuinea-BissauGuyanaHaitiHeavily indebted poor countries (HIPC)High incomeHondurasHong Kong SAR, ChinaHungaryIBRD onlyIcelandIDA & IBRD totalIDA blendIDA onlyIDA totalIndiaIndonesiaIran, Islamic Rep.IraqIrelandIsraelItalyJamaicaJapanJordanKazakhstanKenyaKiribatiKorea, Rep.KosovoKuwaitKyrgyz RepublicLao PDRLate-demographic dividendLatin America & Caribbean Latin America & Caribbean (excluding high income)Latin America & the Caribbean (IDA & IBRD countries)LatviaLeast developed countries: UN classificationLebanonLesothoLiberiaLibyaLithuaniaLow & middle incomeLow incomeLower middle incomeLuxembourgMacao SAR, ChinaMacedonia, FYRMadagascarMalawiMalaysiaMaldivesMaliMaltaMauritaniaMauritiusMexicoMicronesia, Fed. Sts.Middle East & North AfricaMiddle East & North Africa (excluding high income)Middle East & North Africa (IDA & IBRD countries)Middle incomeMoldovaMongoliaMontenegroMoroccoMozambiqueNamibiaNepalNetherlandsNew CaledoniaNew ZealandNicaraguaNigerNigeriaNorth AmericaNorwayOECD membersOmanOther small statesPakistanPanamaPapua New GuineaParaguayPeruPhilippinesPolandPortugalPost-demographic dividendPre-demographic dividendPuerto RicoQatarRomaniaRussian FederationRwandaSaudi ArabiaSenegalSerbiaSeychellesSierra LeoneSingaporeSlovak RepublicSloveniaSmall statesSolomon IslandsSouth AfricaSouth AsiaSouth Asia (IDA & IBRD)South SudanSpainSri LankaSt. Kitts and NevisSt. LuciaSt. Vincent and the GrenadinesSub-Saharan Africa Sub-Saharan Africa (excluding high income)Sub-Saharan Africa (IDA & IBRD countries)SudanSurinameSwazilandSwedenSwitzerlandSyrian Arab RepublicTajikistanTanzaniaThailandTimor-LesteTogoTongaTrinidad and TobagoTunisiaTurkeyTurkmenistanUgandaUkraineUnited Arab EmiratesUnited KingdomUnited StatesUpper middle incomeUruguayUzbekistanVanuatuVenezuela, RBVietnamWest Bank and GazaWorldYemen, Rep.ZambiaZimbabwe La ligne de temps
Cette échelle de temps montre un graphique de 1961 année à 2016 année Malawi. Les données jusqu'à 1960 année ne sont pas présentés. Quantité d'observations actuelles selon dates: 56.
Source (désignation):
Les indicateurs du développement mondiale
Source (organisation):
World Bank national accounts data, and OECD National Accounts data files.
Catégories:
Economy & Growth
Dernière mise à jour
23 avr. 2017
Les indicateurs de changement de valeurs selon les années
Minimum:
144.62 mln.
1 janv. 1961
Maximum:
6.498 mds
1 janv. 2012
Pour la date d''observation
Valeur
Changement absolu
Le changement par rapport à la valeur précédente
1 janv. 1961
144.62 mln.
+144.62 mln.
0.0%
1 janv. 1962
149.38 mln.
+4.76 mln.
3.29%
1 janv. 1963
159.18 mln.
+9.8 mln.
6.56%
1 janv. 1964
166.46 mln.
+7.28 mln.
4.57%
1 janv. 1965
164.64 mln.
-1.82 mln.
-1.09%
1 janv. 1966
192.78 mln.
+28.14 mln.
17.09%
1 janv. 1967
213.5 mln.
+20.72 mln.
10.75%
1 janv. 1968
216.651 mln.
+3.151 mln.
1.48%
1 janv. 1969
200.64 mln.
-16.011 mln.
-7.39%
1 janv. 1970
215.88 mln.
+15.24 mln.
7.6%
1 janv. 1971
211.56 mln.
-4.32 mln.
-2.0%
1 janv. 1972
285.115 mln.
+73.555 mln.
34.77%
1 janv. 1973
310.146 mln.
+25.031 mln.
8.78%
1 janv. 1974
329.565 mln.
+19.419 mln.
6.26%
1 janv. 1975
380.645 mln.
+51.08 mln.
15.5%
1 janv. 1976
422.767 mln.
+42.122 mln.
11.07%
1 janv. 1977
456.292 mln.
+33.526 mln.
7.93%
1 janv. 1978
535.369 mln.
+79.077 mln.
17.33%
1 janv. 1979
595.203 mln.
+59.834 mln.
11.18%
1 janv. 1980
724.221 mln.
+129.017 mln.
21.68%
1 janv. 1981
865.415 mln.
+141.194 mln.
19.5%
1 janv. 1982
870.547 mln.
+5.132 mln.
0.59%
1 janv. 1983
795.919 mln.
-74.628 mln.
-8.57%
1 janv. 1984
836.168 mln.
+40.249 mln.
5.06%
1 janv. 1985
839.335 mln.
+3.167 mln.
0.38%
1 janv. 1986
785.529 mln.
-53.807 mln.
-6.41%
1 janv. 1987
828.285 mln.
+42.757 mln.
5.44%
1 janv. 1988
780.625 mln.
-47.66 mln.
-5.75%
1 janv. 1989
994.807 mln.
+214.182 mln.
27.44%
1 janv. 1990
1.19 mds
+195.398 mln.
19.64%
1 janv. 1991
1.345 mds
+155.291 mln.
13.05%
1 janv. 1992
1.626 mds
+280.523 mln.
20.85%
1 janv. 1993
1.534 mds
-92.273 mln.
-5.67%
1 janv. 1994
1.82 mds
+286.154 mln.
18.66%
1 janv. 1995
844.512 mln.
-975.387 mln.
-53.6%
1 janv. 1996
1.109 mds
+264.751 mln.
31.35%
1 janv. 1997
1.887 mds
+778.134 mln.
70.15%
1 janv. 1998
2.213 mds
+326.016 mln.
17.27%
1 janv. 1999
1.351 mds
-862.203 mln.
-38.95%
1 janv. 2000
1.548 mds
+196.955 mln.
14.58%
1 janv. 2001
1.423 mds
-125.66 mln.
-8.12%
1 janv. 2002
1.381 mds
-41.913 mln.
-2.95%
1 janv. 2003
3.054 mds
+1.673 mds
121.21%
1 janv. 2004
2.83 mds
-224.176 mln.
-7.34%
1 janv. 2005
3.149 mds
+318.821 mln.
11.27%
1 janv. 2006
3.412 mds
+263.088 mln.
8.36%
1 janv. 2007
3.506 mds
+93.836 mln.
2.75%
1 janv. 2008
3.357 mds
-148.32 mln.
-4.23%
1 janv. 2009
4.267 mds
+909.535 mln.
27.09%
1 janv. 2010
4.412 mds
+144.935 mln.
3.4%
1 janv. 2011
5.234 mds
+822.103 mln.
18.63%
1 janv. 2012
6.498 mds
+1.264 mds
24.16%
1 janv. 2013
5.324 mds
-1.174 mds
-18.06%
1 janv. 2014
4.23 mds
-1.094 mds
-20.55%
1 janv. 2015
4.9 mds
+670.011 mln.
15.84%
1 janv. 2016
5.208 mds
+307.517 mln.
6.28%
Classement des pays selon les statistiques actuelles par années


Commentaires: